The corporate bond 737NTPC35C (TFB 7.37% 2035 SR. 3A, an NTPC tax free bond maturing in 2035) has a price chart that looks like a sawtooth. Every few sessions the closing price jumps by 100 to 200 points, then jumps back. This has repeated for more than two years. The obvious guess is accrued interest. A bond's price should rise smoothly as interest builds up between coupon dates, then drop sharply on the coupon date itself. A real accrued interest sawtooth has a shape. A slow climb followed by a sudden fall. This chart does not have that shape. We treated it as a modelling question rather than a one line explanation, and used a Hidden Markov Model to work out what was actually going on.
What the raw data actually shows
According to insights from bhavcopydata.com, 737NTPC35C traded on 184 sessions between 8 May 2024 and 20 August 2026, an average of 1.48 trades and about 63 units a day, INR 1.4 crores of turnover across the whole two and a quarter years. That is about as thin as a listed bond gets. Almost every session that does trade, the price lands close to one of two levels. Roughly INR 1,150 to 1,200 on one side and roughly INR 1,350 to 1,450 on the other. The price flips between them from one trading day to the next far more often than it should if this were one continuous price process with noise on top.
That rules out the accrued interest story. Accrued interest builds up gradually and resets on a fixed coupon date, it does not flip back and forth, session to session. What this looks more like is two different quotes being crossed on different days, possibly a clean price on some days and a dirty price on others. Since bhavcopydata.com does not carry coupon dates or accrued interest figures, that specific cause cannot be confirmed from this data alone. What can be tested directly is whether the bond is genuinely switching between two price regimes, and a Hidden Markov Model is built exactly for that kind of question.
Fitting a two state Hidden Markov Model
A Hidden Markov Model assumes the data was generated by an unobserved process that sits in one of a small number of hidden states at any point in time, switching between them with some probability. Each state produces observations drawn from its own distribution. We fit a two state Gaussian HMM (Hidden Markov Model) to the log of 737NTPC35C's closing price, one state for a lower price regime and one for a higher one.
from hmmlearn.hmm import GaussianHMM

model = GaussianHMM(n_components=2, covariance_type="diag", n_iter=200)
model.fit(log_prices)
states = model.predict(log_prices)
The model recovered two states with means of INR 1,163 and INR 1,319, a gap of 13.4%, and assigned the bond to the higher state on 59.2% of its trading sessions. More importantly, the transition matrix it learned has self transition probabilities of 0.2% for the lower state and 37.9% for the higher one. In plain terms, once the bond lands in its lower price state it almost always flips to the higher one on the very next trade. We defined a single switch score for each bond as one minus the average self transition probability. Therefore, a score near 1 means the bond flips state on almost every trade, and a score near 0 means it tends to stay in the same state.
p_self = model.transmat_.diagonal()
switch_score = 1 - p_self.mean()
737NTPC35C (TFB 7.37% 2035 SR. 3A, an NTPC tax free bond maturing in 2035) scores 0.809 on this measure. The chart below plots every trading session, coloured by which hidden state the model assigned it to.
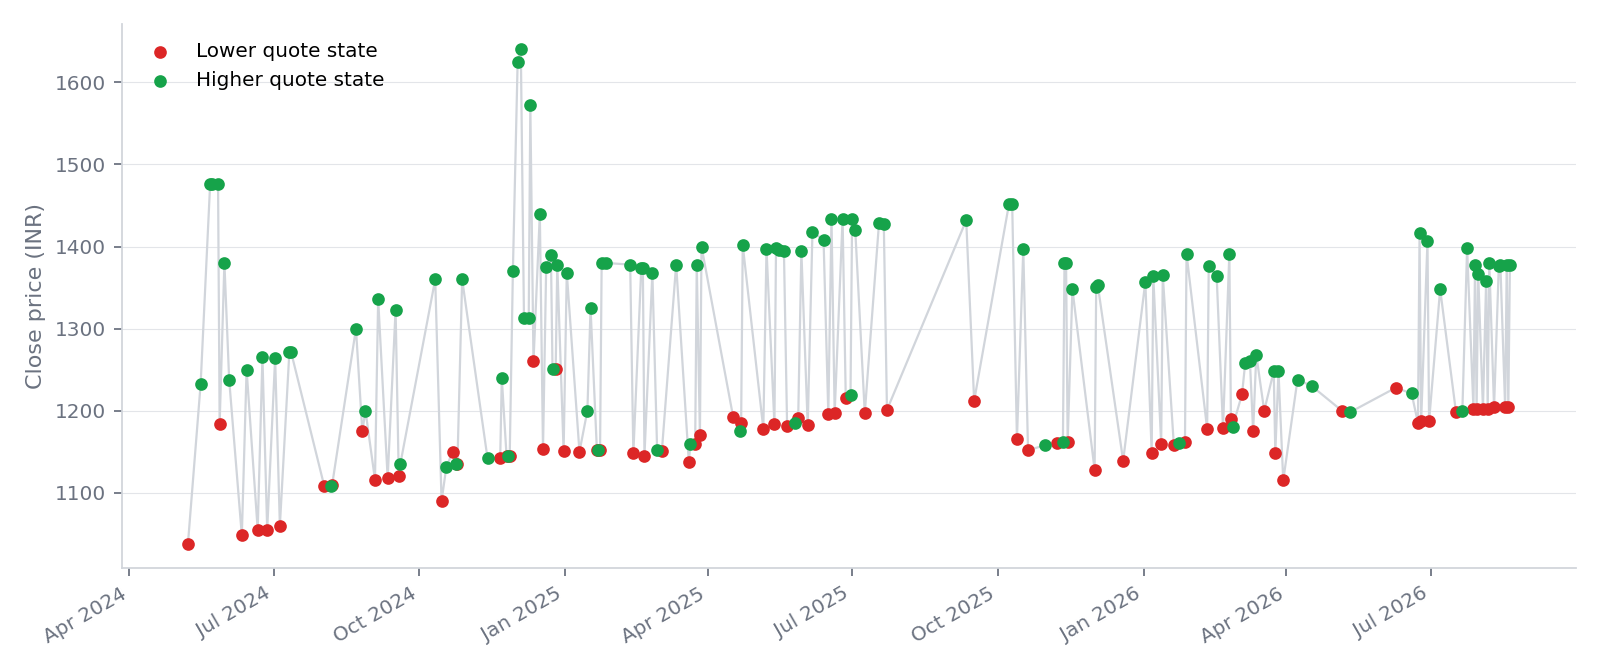
The two coloured bands sit almost entirely apart, with very little overlap between them. That is a genuine two state pattern, not a model reading structure into noise.
Running the same model across the whole corporate bond universe
One bond is an anecdote. To find out whether this is a real phenomenon or a one off curiosity, we pulled the full trading history for every corporate bond ever recorded on bhavcopydata.com, 912 symbols and 82,962 daily rows, and fit the same two state HMM to every bond with at least 30 trading sessions, 543 bonds in total. For each one we kept the same switch score, and only treated a bond as genuinely two state if its hidden state means were separated by more than 3%, since a smaller gap usually means the model split noise into two nearly identical states rather than finding a real pattern. 255 bonds cleared that bar.
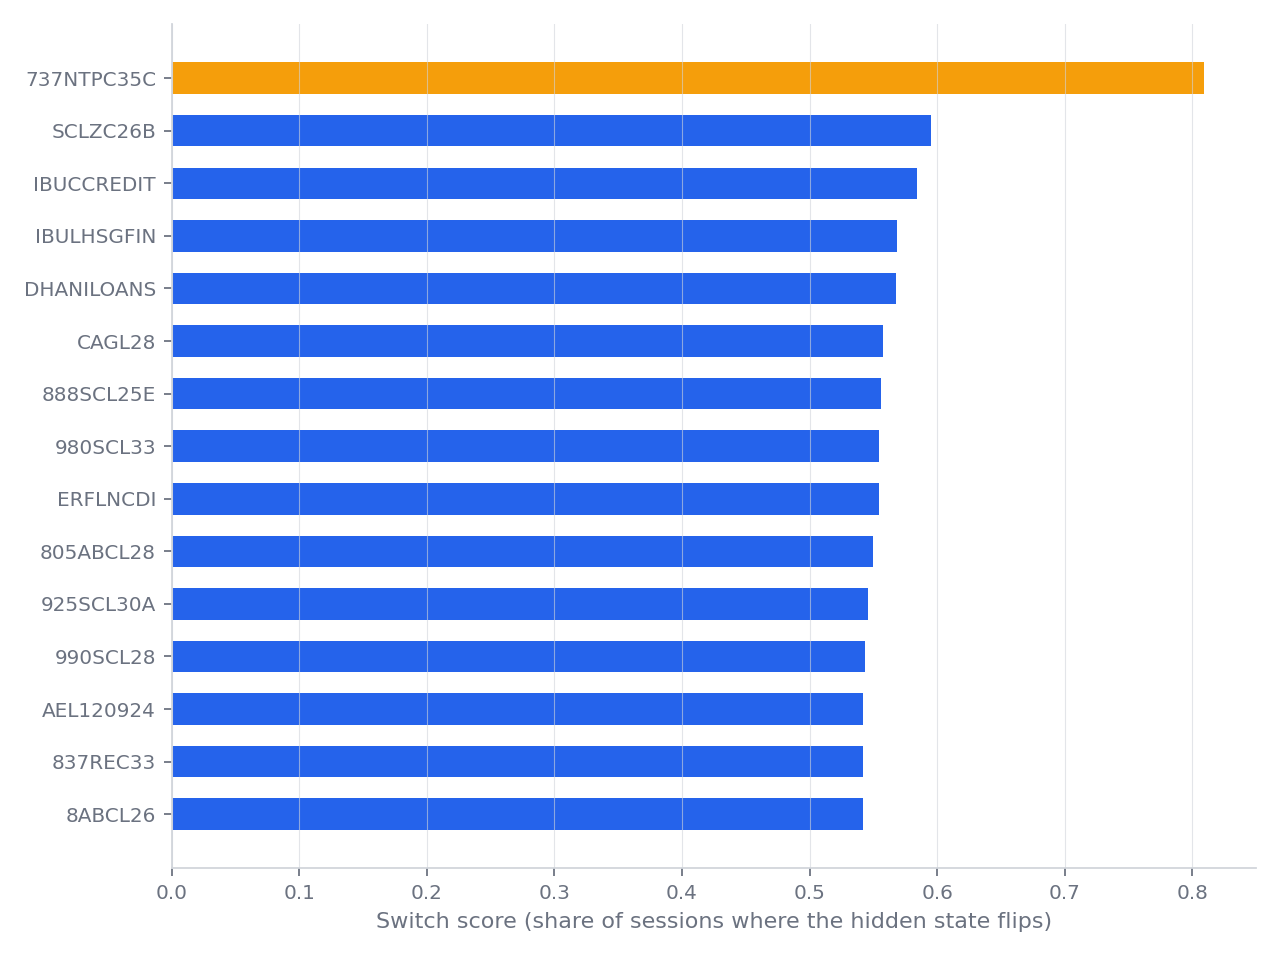
737NTPC35C tops the list by a wide margin, at 0.809 against 0.595 for the next name, SCLZC26B (SEC RE NCD SR VI). That is not a coincidence in a single chart, it is the most extreme example of a pattern that shows up, in a smaller form, across a genuine slice of the corporate bond segment. Several names further down the list, IBUCCREDIT (SEC RE NCD 10.03% SR.VIII), IBULHSGFIN (SEC RE NCD SR.VI), and DHANILOANS (SEC RE NCD 10.49% SR.VII) among them, show the same two band structure on their own charts.
A data quality bug the model caught on its own
One symbol scored high enough to make the list at first, and it turned out not to be a bond pattern at all. The symbol NTPC in the raw table mixes two completely different instruments together. Most of its rows show bond like prices between roughly INR 1,000 and INR 1,300, but six sessions scattered through 2024 show a price of about INR 5 to INR 11 with 19,000 to over 135,000 units changing hands. Nothing like the rest of the series. That is a symbol collision in the underlying data, not a real two state trading pattern. Therefore, we excluded it from the ranking above and flagged it for a fix on the ingestion side. It is a useful reminder that a model built to find structure will just as happily find a data quality problem if one is sitting in the input. And that every unusual result still needs a manual check before it is trusted. The same discipline this site already applies to any single day price move beyond 50%.
Testing the obvious explanation, and ruling it out
The obvious guess is that this is just illiquidity, fewer trades should mean noisier, more erratic pricing. We tested that directly by plotting each bond's average trades per day against its switch score.
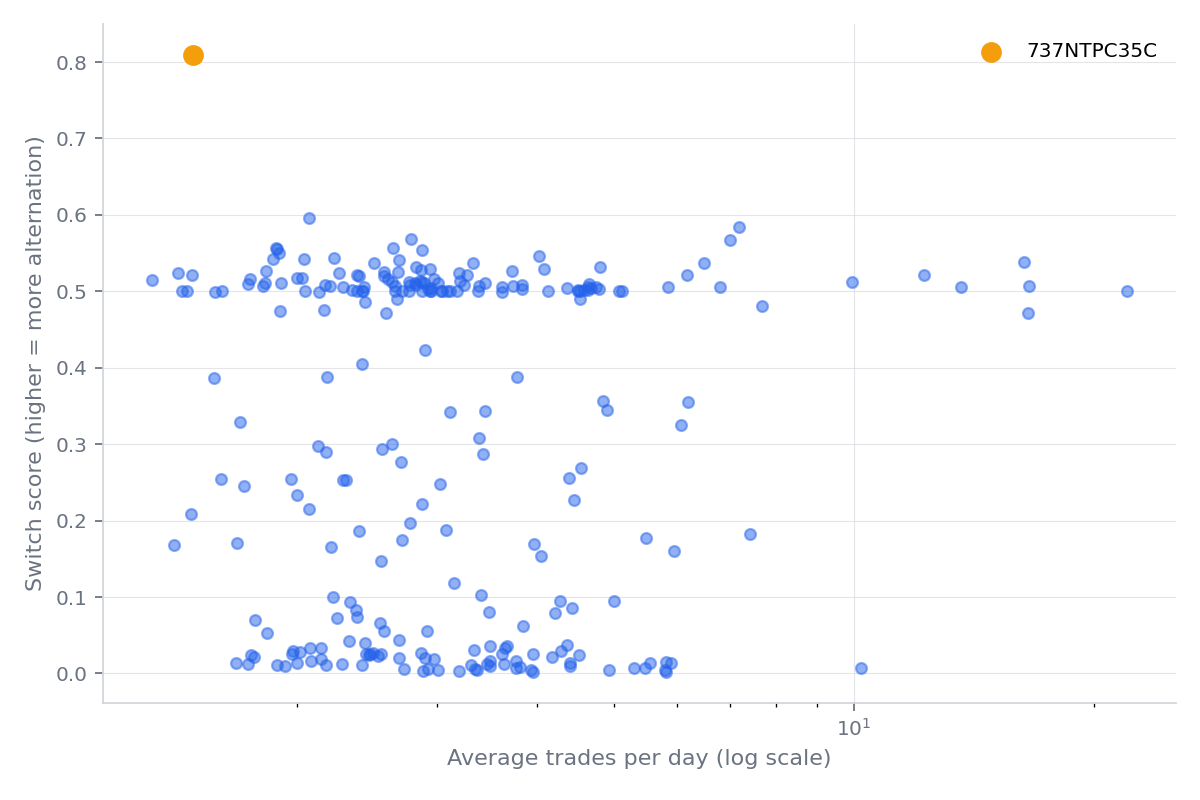
There is no relationship. The correlation between the two is 0.02, effectively zero. And bonds trading anywhere from about one to over 20 times a day show the same wide spread of switch scores. Whatever drives a bond to bounce between two price levels, it is not simply a function of how often it trades. Some genuinely illiquid bonds sit in a single stable state for years, and some more actively traded ones still flip constantly. This was the most interesting negative result of the exercise, a clean model output that ruled out the illiquidity guess rather than confirming it.
What this does and does not tell us
The Hidden Markov Model gives a precise, repeatable way to detect and rank a pattern that would otherwise live only in a chart someone happens to notice. That part is solid given that the states are genuinely well separated for 737NTPC35C (TFB 7.37% 2035 SR. 3A, an NTPC tax free bond maturing in 2035) and for many of the other bonds ranked highly above. What it cannot do, without more data than bhavcopydata.com currently carries, is to confirm the mechanism behind it. Coupon dates, accrued interest schedules and counterparty level quote data would be needed to test the clean price versus dirty price hypothesis directly, and none of that is in the NSE bhavcopy files this site is built on. There is also a subtler risk with a 543 bond scan like this one. Some of the switch scores in the middle of the pack are likely small sample noise rather than a real signal. Since a handful of trades scattered over a year gives a Gaussian HMM very little to work with, we only treated the 255 bonds with a clear separation between states as worth ranking at all, rather than trusting every switch score on its own.
Corporate bond turnover and trade level data for every bond on this list, 737NTPC35C (TFB 7.37% 2035 SR. 3A, an NTPC tax free bond maturing in 2035) included, are available on the Corporate Bonds page.
All figures are from NSE end of day bhavcopy data, as published on bhavcopydata.com. Follow the author at @psanivarapu or at prashanthsanivarapu for more.