A minority of clients run almost all the volume. 257 of 666 active clients in block and bulk deals, just 38.6% of them, account for 87.7% of every deal row and 64.6% of total deal value recorded on bhavcopydata.com since January 2024. We did not assume this split in advance. Based on insights from bhavcopydata.com, we built six behavioral features per client with no labels attached, ran unsupervised clustering, and the algorithm drew this line on its own.
The problem with calling this a classifier
Last week's wrap showed PC Jeweller Limited (PCJEWELLER) carrying INR 4,206.4 crores of block and bulk deal value, more than any other stock that week, almost entirely from three proprietary trading firms buying and selling nearly identical amounts of the same stock. We caught that by hand. The obvious next step is to automate it, but NSE's deal data carries no field anywhere that says a trade was market making rather than conviction, so there is nothing to train a supervised classifier against. Any label we invented ourselves, such as buy value close to sell value, would just teach a model to repeat the rule we already used to invent the label. That is not learning anything new.
Unsupervised clustering sidesteps the problem entirely. It needs no labels, only behavior, and if real structure exists in how clients trade, it should fall out on its own.
Six features, no labels
We pulled every row from block_deals and bulk_deals since 1 January 2024, normalized client names, and grouped by client to compute six features, buy and sell symmetry, the share of a client's own (symbol, date) pairs where it both bought and sold the same stock the same day, number of distinct symbols traded, number of active trading days, total deal value, and average deal size.
sym = min(buy_value, sell_value) / max(buy_value, sell_value)
pairs = df.groupby(["client", "symbol", "trade_date"])["buy_sell"]
reversal = pairs.agg(lambda s: {"BUY", "SELL"}.issubset(set(s)))
reversal_rate = reversal.groupby(level=0).mean()
We kept clients with at least 5 deals and INR 50 crores of total value, 666 of them, to avoid building unstable estimates from a single appearance. After log transforming the skewed count and size features and scaling everything, we ran k means clustering.
X = StandardScaler().fit_transform(features)
km = KMeans(n_clusters=4, n_init=20, random_state=42)
labels = km.fit_predict(X)
Every known name landed where it should
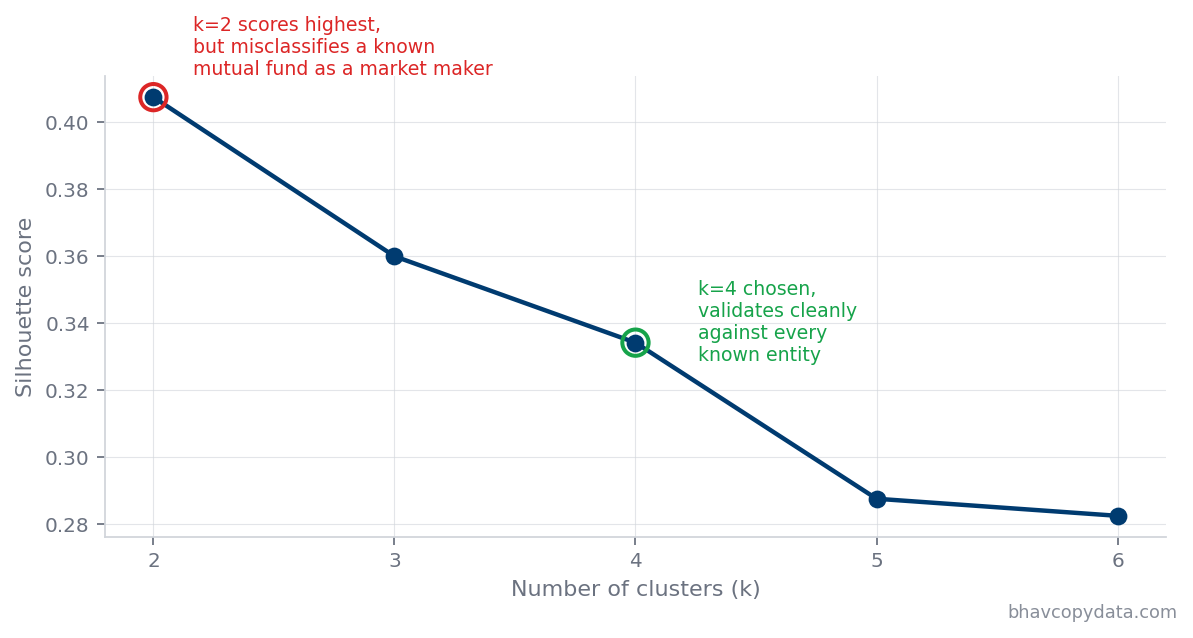
We tested k from 2 to 6 and checked the resulting clusters against entities already named in the last two weekly wraps, since those are the only cases where we independently know, from manually tracing individual deals, what each client actually was. k equal to 2 scored highest on silhouette, the standard internal measure of cluster separation, but it placed SBI Mutual Fund inside the market making cluster, a clear miss given the fund's real, moderate symmetry of 0.29 across hundreds of deals since 2024. k equal to 4 scored lower on that same measure but got every test case right, which is the result that actually matters here. Relying on the silhouette score alone would have picked the wrong answer.
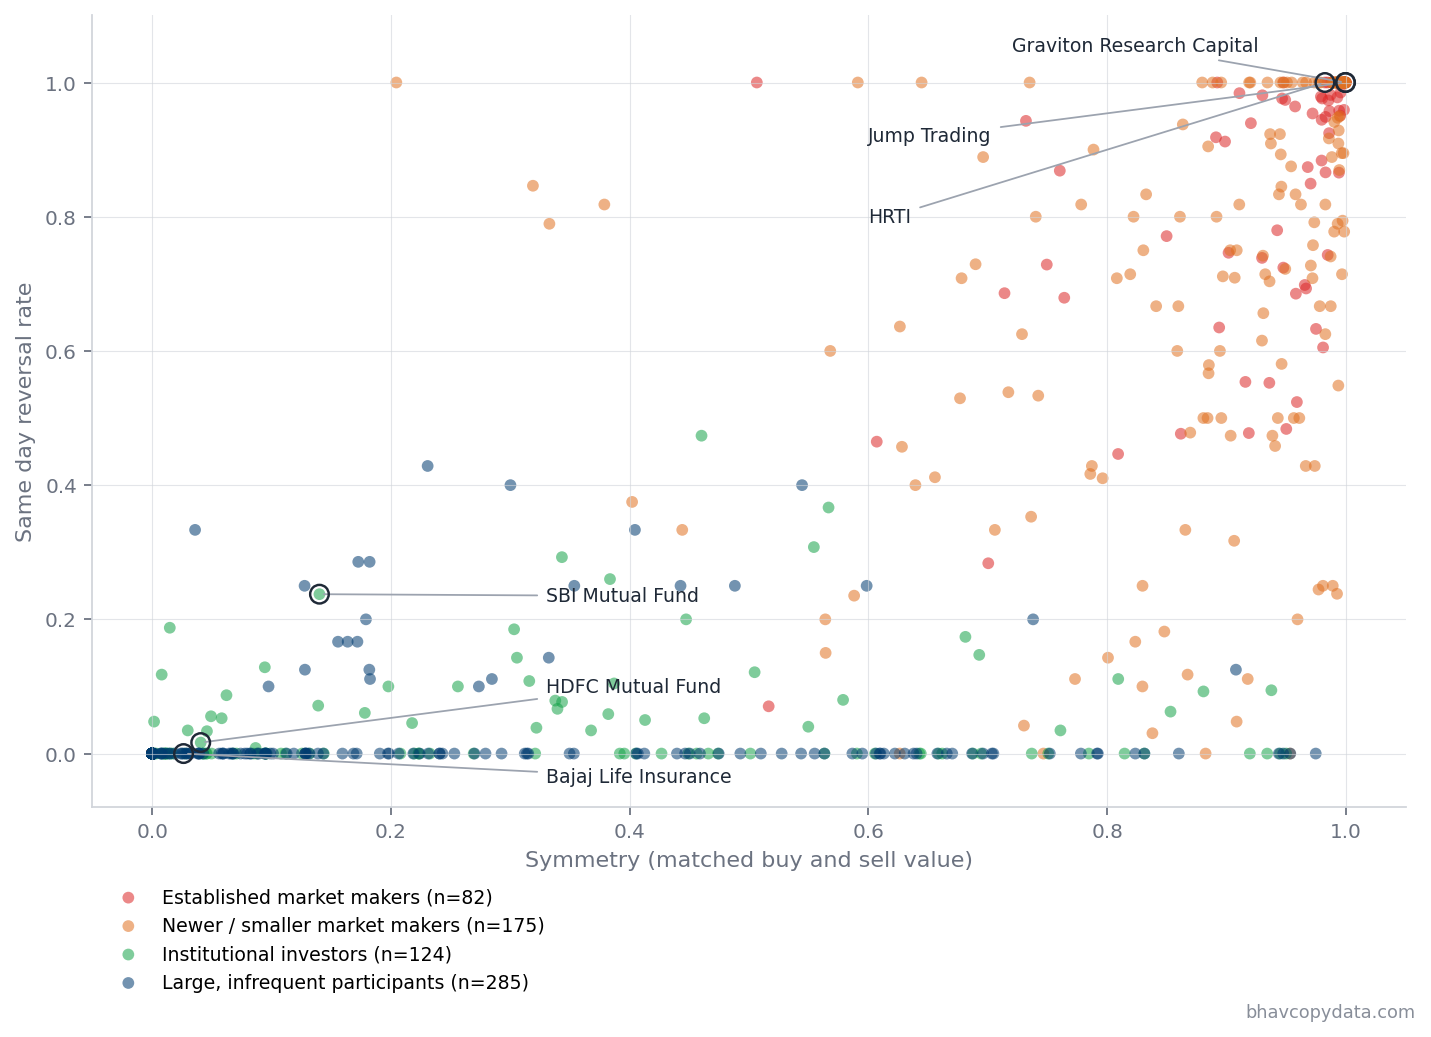
The four groups that fell out of k equal to 4 split cleanly along lines that match what the last two posts found by hand. 82 clients formed a tight group with average symmetry of 0.93, trading across long, sustained windows. Graviton Research Capital LLP, HRTI Private Limited, Jump Trading Financial India Private Limited, QE Securities LLP, NK Securities Research Private Limited and Irage Broking Services LLP all landed here, every firm identified as a market maker across our recent weekly wraps. A second, larger group of 175 clients showed similarly high symmetry but far fewer active trading days on average, 17 against the first group's much longer history, newer or smaller scale versions of the same behavior.
A third group of 124 clients averaged symmetry of just 0.29 and traded on 24 active days on average, a moderate, ongoing cadence with a real directional lean. SBI Mutual Fund, HDFC Mutual Fund, Invesco Mutual Fund and ICICI Prudential Mutual Fund all sit here, alongside PI Opportunities AIF V LLP and Prazim Trading And Investment Company Private Limited, the two counterparties behind last week's coordinated transfer across Adani Energy Solutions Limited (ADANIENSOL), Manipal Health Enterprises Limited (MANIPALHOS) and Shriram Pistons & Rings Limited (SHRIPISTON). Prazim's full history shows symmetry of 0.66, a more mixed picture than the one sided seller it looked like in that single week.
The fourth group, 285 clients, traded rarely, just 5.5 active days on average, but at the largest average size of any group, INR 177.9 crores per deal. Bajaj Life Insurance Limited sits here. This group reads as the home for large, infrequent placements, the kind of one off block transfer that shows up once and does not repeat.
What this does not prove
We have no ground truth for this problem, and six client level features do not exist to be definitively labeled as behavior rather than identity. A client with a long, stable history of buying and selling in matched size is still, in a strict sense, demonstrating a pattern, not a legally verified role. We validated against a handful of names already confirmed through the manual deal tracing in our last two weekly wraps, not a formal held out test set, because no such test set exists for this question anywhere. The 666 clients clustered here are also only the clients active enough to produce a stable estimate. Firms like Allianz Global Investors GmbH or Catamaran Ventures LLP, flagged in last week's wrap for a single large transaction, fall below our activity threshold entirely and cannot be reliably placed by this method. And the totals themselves inherit the same double counting already flagged in our weekly wraps, a trade reported through both the block and bulk windows counts twice, so the absolute crore figures here should be read as gross activity, not netted institutional demand.
What the clustering does show plainly is the shape of the imbalance. A minority of clients by headcount account for the overwhelming majority of deal activity, and which minority that is can be recovered from trading behavior alone, with no label ever supplied. The next time a single stock's combined block and bulk deal value looks unusually large on the Smart Money page, this is the kind of check worth running before reading it as conviction.
Track the full list, updated daily, on the Smart Money page. More insights are on bhavcopydata.com.
All figures are from NSE end of day bhavcopy data, as published on bhavcopydata.com. Follow the author at @psanivarapu or at [prashanthsanivarapu] https://www.linkedin.com/in/prashanthsanivarapu for more.