We pulled daily returns for every ETF on bhavcopydata.com with at least 500 of the 684 trading days recorded since 1 January 2024. 200 funds in total. We then executed hierarchical clustering on the correlation between them with no category labels attached. The algorithm had no idea which funds the site calls Equity Index, Sector and Thematic, Commodity or International. It only saw 2.75 years of daily percentage moves. What it found lines up with a real event this week. The Motilal Oswal Nasdaq Q-50 ETF (MONQ50) and two other funds rose between 13% and 30%, while three other funds carrying the exact same "International" label barely moved.
Clustering with no labels rediscovers real asset classes
We excluded the Debt category outright before clustering. These are overnight and liquid funds whose daily move sits within a few basis points of zero on almost every session. The near zero variance would swamp a correlation based distance with noise rather than signal. That left 172 ETFs. We built the full pairwise correlation matrix of daily returns, converted it to a distance (one minus correlation), and ran average linkage hierarchical clustering, cutting the resulting tree into 25 groups.
dist = 1 - returns.corr()
Z = linkage(squareform(dist, checks=False), method="average")
labels = fcluster(Z, t=25, criterion="maxclust")
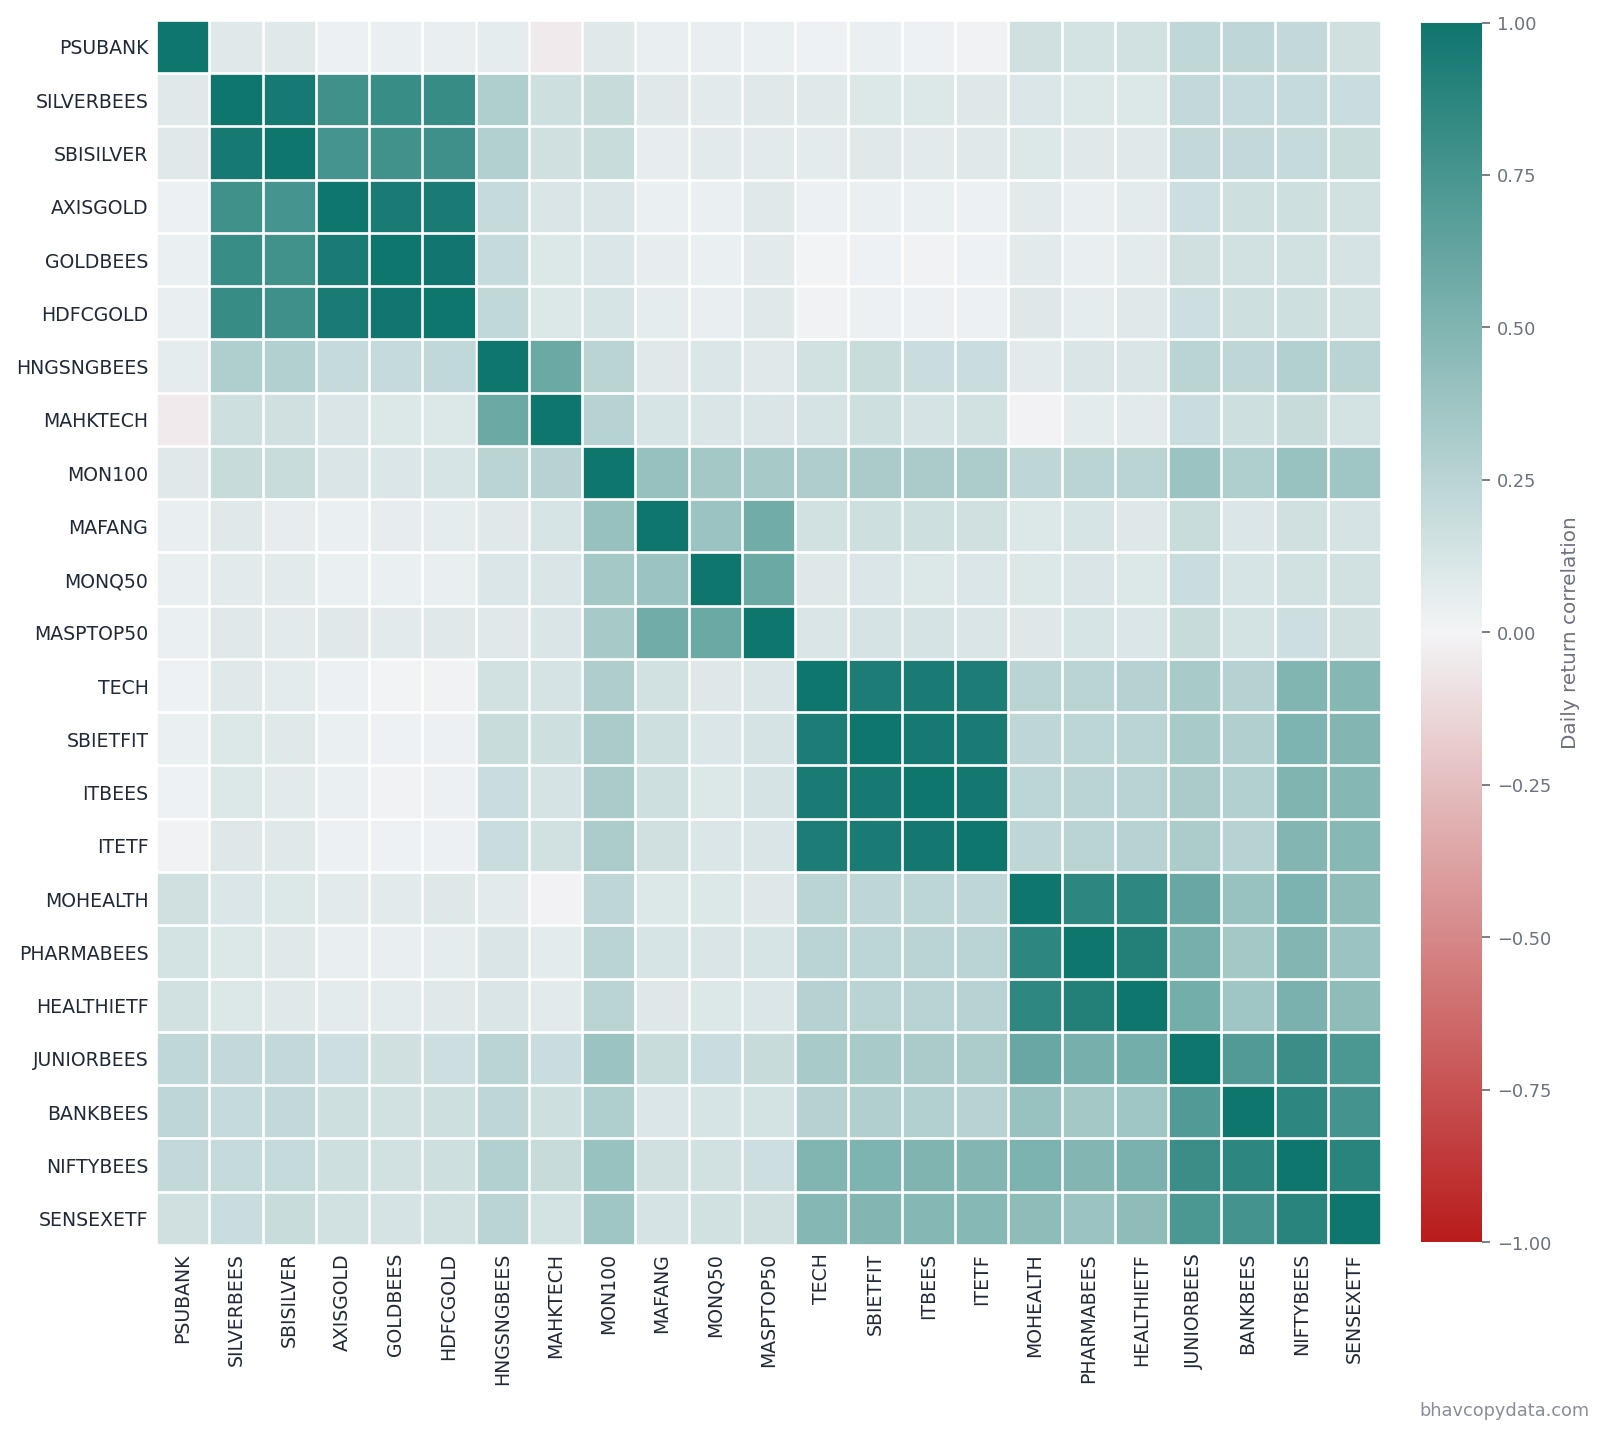
The single cleanest group in the output contains 21 funds, and every one of them is a Gold or Silver ETF. Among these are the Nippon India ETF Gold BeES (GOLDBEES), the Axis Gold ETF (AXISGOLD) and the HDFC Gold ETF (HDFCGOLD). No other fund lands in that cluster, and no gold or silver fund lands anywhere else. The algorithm found that split with no help from the bhavcopydata.com's own category field, which is exactly what real asset class behaviour should look like. It considered gold and silver trading as one distinct risk factor rather than as interchangeable equity exposure.
At the other extreme, one fund landed alone, uncorrelated with everything else in the dataset. The Kotak PSU Bank ETF (PSUBANK) is the same fund this site flagged in July for an apparent 89.6% single day drop that turned out to be an unadjusted unit split. The algorithm with no knowledge of that earlier post still isolated PSUBANK by itself, which is what we would expect from a fund whose price history is dominated by one unexplained jump rather than by co-movement with the rest of the market. That match is a reasonable sign that the clustering is picking up something real.
The International label hides at least three different funds
bhavcopydata.com groups six long running funds under the International category, the Motilal Oswal Nasdaq Q-50 ETF (MONQ50), the Mirae Asset S&P 500 Top 50 ETF (MASPTOP50), the Mirae Asset NYSE FANG+ ETF (MAFANG), the Motilal Oswal Nasdaq 100 ETF (MON100), the Nippon India ETF Hang Seng BeES (HNGSNGBEES) and the Mirae Asset Hang Seng TECH ETF (MAHKTECH). The clustering, working from nothing but 2.75 years of daily returns. It does not treat those six funds as one group. MONQ50 and MASPTOP50 land together. HNGSNGBEES and MAHKTECH, the two funds that actually track Hong Kong listed stocks, land together in a separate cluster. MAFANG and MON100 each sit alone, closer to the United States pair than to the Hong Kong pair but not tight enough to merge with either group outright.
This week tested that split directly
The six International funds' actual performance this week, 5 to 9 October 2026, lines up with that split closely. MONQ50 rose 30.46%, MASPTOP50 rose 13.36% and MAFANG rose 15.66%, the three names the clustering had already grouped with each other. HNGSNGBEES rose just 1.27% and MAHKTECH rose 3.71%. MON100, the fund clustered on its own, rose only 0.94%. A reader who only saw the single "International" label on bhavcopydata.com this week would have no way to know that three of these six funds moved ten to thirty times further than the other three. The clustering would have told them which three to watch, before the week happened.
The correlation behind the rally was not normal for these two funds
We also tracked the 20 day rolling correlation between MONQ50 and its two closest International peers across the full history, rather than compare a single snapshot.
window = 20
rolling_corr = monq50_returns.rolling(window).corr(masptop50_returns)
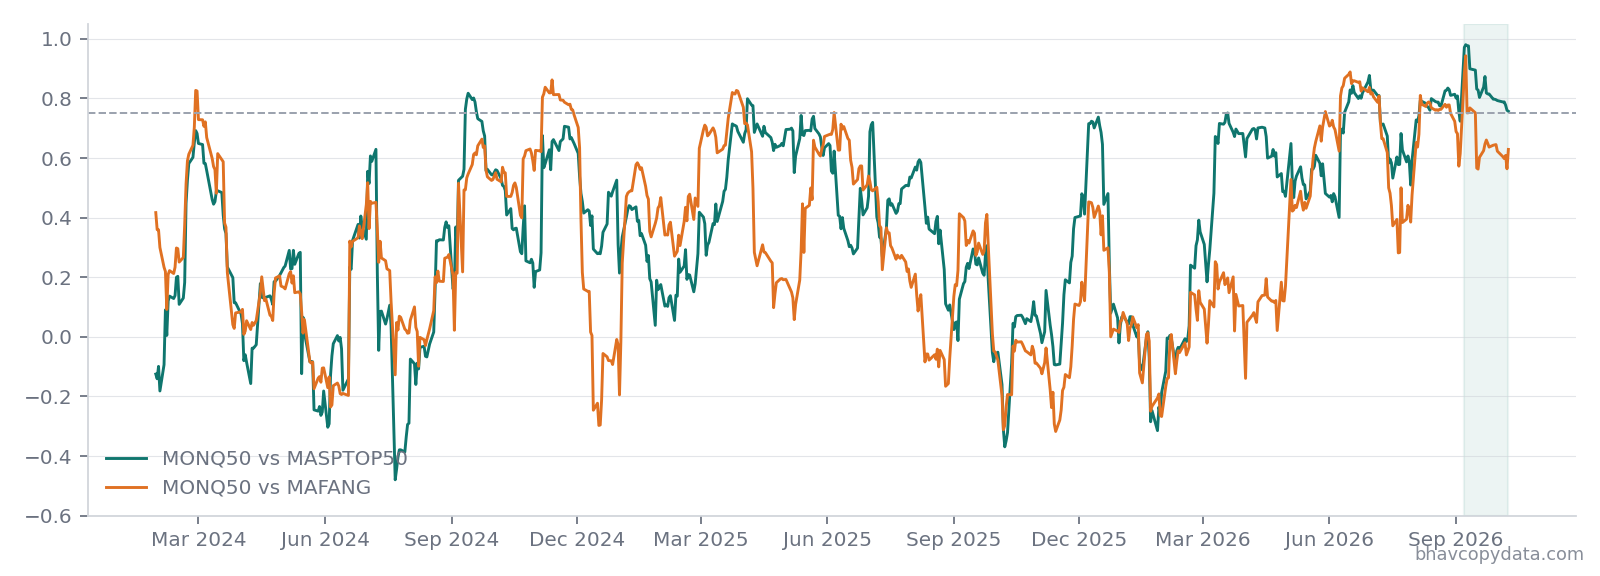
Over the full 2.75 years, MONQ50 and MASPTOP50 average a correlation of just 0.377, with a standard deviation of 0.309, drifting between roughly flat and strongly correlated depending on the stretch. The three weeks ending 9 October 2026 average 0.801, the 94.6th percentile of every 20 day reading in the dataset. The correlation has stayed above 0.75 for 23 trading days starting 7 September 2026, making it the longest of only six such episodes across 2.75 years. The next longest running is 21 days and 17 days. On 8 September 2026 it touched 0.9805, the single highest reading between these two funds anywhere in the full history.
A Pearson correlation measured over just the final weeks can be swayed by a handful of extreme days rather than genuine sustained co-movement, the same caution that mattered in our earlier SME co-movement post. Recomputed with Spearman rank correlation, which only cares about the order of daily moves and not their size, the last 15 day average between MONQ50 and MASPTOP50 comes out even higher. 0.824 against 0.801 under Pearson, at the 96.5th percentile of the full distribution rather than lower. The spike survives the more robust check, so it is not an artifact of one or two outsized days.
The rally did not pull every pair into lockstep equally. MAFANG and MASPTOP50, the pair with the highest average correlation over the full history at 0.600, barely moved. A recent three week mean of 0.651 was at only the 53rd percentile. MAFANG and MONQ50 did join the regime shift, rising from a historical mean of 0.323 to a recent mean of 0.626. The 78th percentile, but less dramatically than MONQ50 and MASPTOP50.
What this does and does not establish
A sustained and a resistant-to-rank correlation of this nature is a genuine statistical pattern and not a coincidence the robustness check would have exposed. There is no evidence that the three funds share a manager or a benchmark or a deliberate positioning. Nothing here establishes the why. A boring explanation is also the likely one. MONQ50, MASPTOP50 and MAFANG all hold concentrated baskets of the same handful of large United States technology stocks. Therefore a swing large enough to move all three at once is expected. What the clustering and the correlation check together show is that this trio, out of six funds carrying the same category label on the site, is the one actually exposed to shared risk. This week's swing sat inside the most sustained period of co-movement between MONQ50 and MASPTOP50 anywhere in the 2.75 years of data checked. Nothing here is investment advice.
Track all six funds on the ETF page. More insights are on bhavcopydata.com.
All figures are from NSE end of day bhavcopy data, as published on bhavcopydata.com. Follow the author at @psanivarapu or at prashanthsanivarapu for more.