Over the two weeks between 27 July 2026 and 07 August 2026, insights from bhavcopydata.com flagged 17 fresh options signals across 13 NSE stocks. Every single one of them showed the same pattern. The options market was pricing a smaller move to expiry than the stock's own recent trading range suggested.
Most retail content about implied volatility talks about IV Rank and whether options are cheap or expensive relative to their own history. It rarely compares what the options market expects against what the stock's own chart has actually been doing lately. That comparison is the kind of insight that only shows up once you track both numbers side by side every day.
What we compared
For every fresh call or put candidate that came out of the daily screen, insights from bhavcopydata.com already compute two separate estimates of how far the stock could move before the option expires.
The first is the options implied move. This comes from the at the money option's implied volatility, scaled by the square root of time to expiry. It is what the options market itself is pricing in.
The second is the chart implied move. This comes from the stock's own 14 day average true range, scaled the same way. It is what the stock's own recent daily swings suggest for a move over the same number of days.
If options pricing and recent price action agree, the two numbers should sit close to each other. If they do not agree, one side is saying something the other is not.
The gap, name by name
Here is every stock that got flagged in this window, with both figures averaged across every day it was flagged.
| Company (Symbol) | Options implied move | Chart implied move | Gap | IV Rank on the day |
|---|---|---|---|---|
| Blue Star (BLUESTARCO) | 8.33% | 16.65% | 8.32 points | 63.9% |
| Aditya Birla Capital (ABCAPITAL) | 6.69% | 13.42% | 6.73 points | 25.3% |
| AU Small Finance Bank (AUBANK) | 5.32% | 11.64% | 6.32 points | 28.6% |
| TVS Motor Company (TVSMOTOR) | 7.08% | 13.23% | 6.15 points | not available yet |
| Bajaj Finance (BAJFINANCE) | 6.10% | 12.21% | 6.11 points | not available yet |
| Hindustan Unilever (HINDUNILVR) | 6.60% | 12.69% | 6.09 points | not available yet |
| Aurobindo Pharma (AUROPHARMA) | 5.62% | 11.05% | 5.44 points | 25.4% |
| PNB Housing Finance (PNBHOUSING) | 8.60% | 13.61% | 5.01 points | 49.8% |
| GAIL (GAIL India Ltd) | 6.75% | 10.17% | 3.42 points | not available yet |
| Bosch (BOSCHLTD) | 7.41% | 10.52% | 3.11 points | 64.7% |
| Siemens (SIEMENS) | 9.77% | 12.49% | 2.72 points | 96.0% |
| Grasim Industries (GRASIM) | 7.41% | 8.56% | 1.16 points | 92.3% |
| Hindustan Aeronautics (HAL) | 7.93% | 8.87% | 0.94 points | 62.0% |
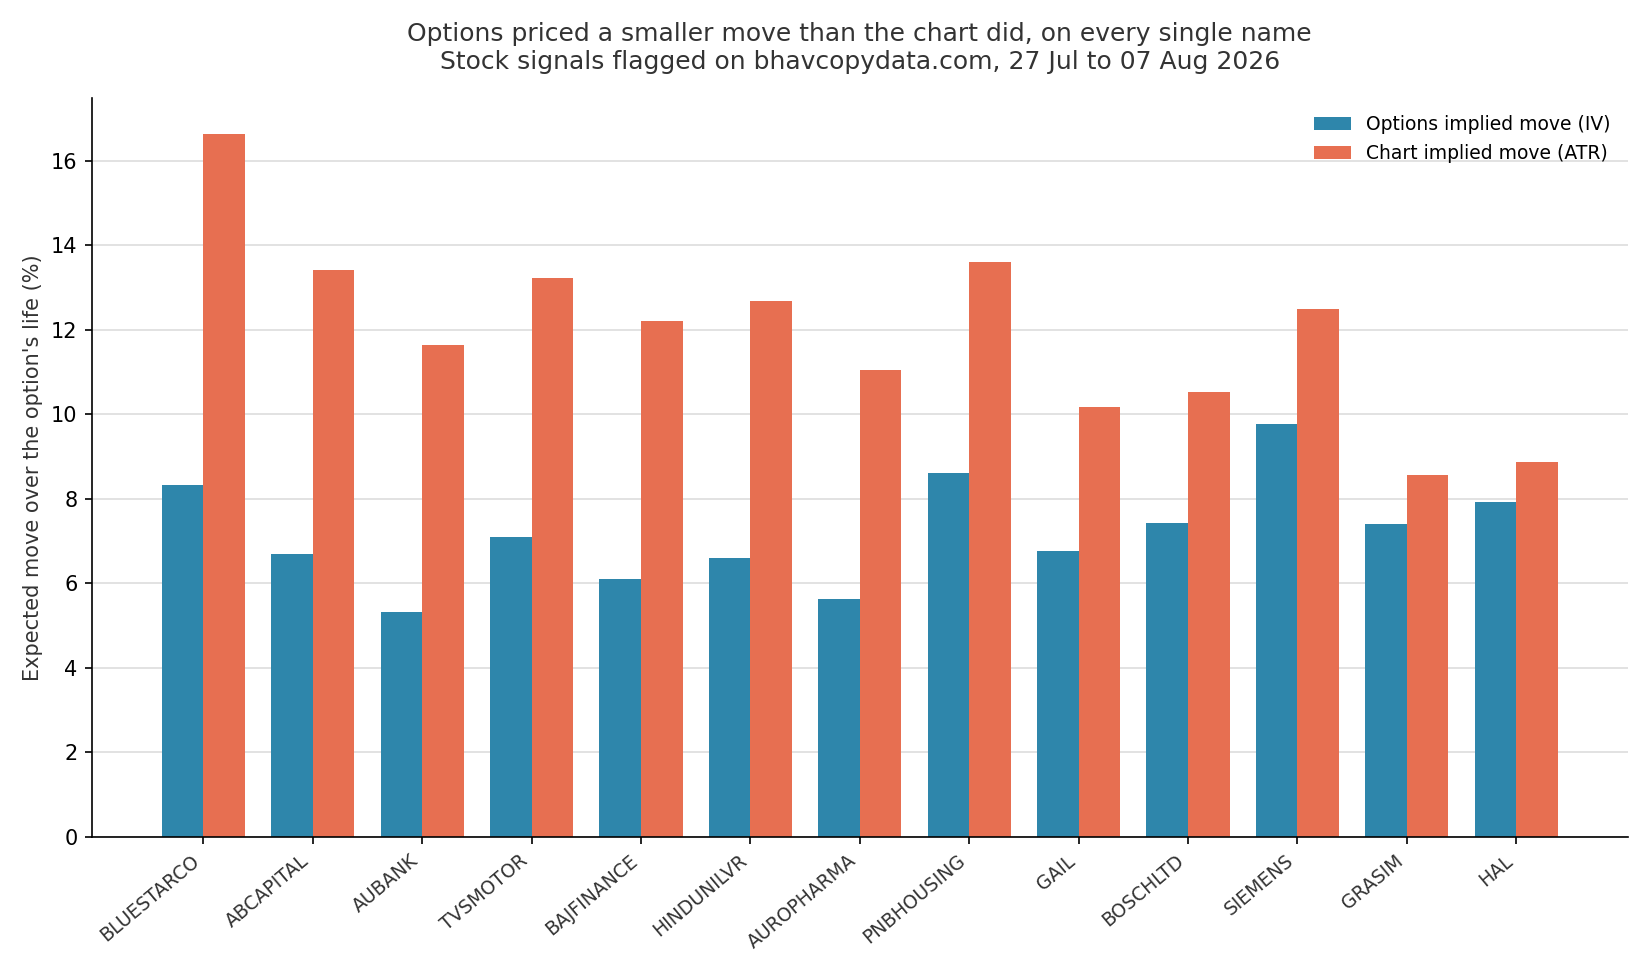
Averaged across all 17 signals, the options implied move worked out to about 7.0%, against a chart implied move of about 11.8%. That puts options pricing at roughly 60% of what the chart was suggesting.
Here is the same table as a chart.
Even expensive options were not expensive enough
The obvious question is whether this gap only shows up in cheap options that nobody wants to buy. Does not seem to be so.
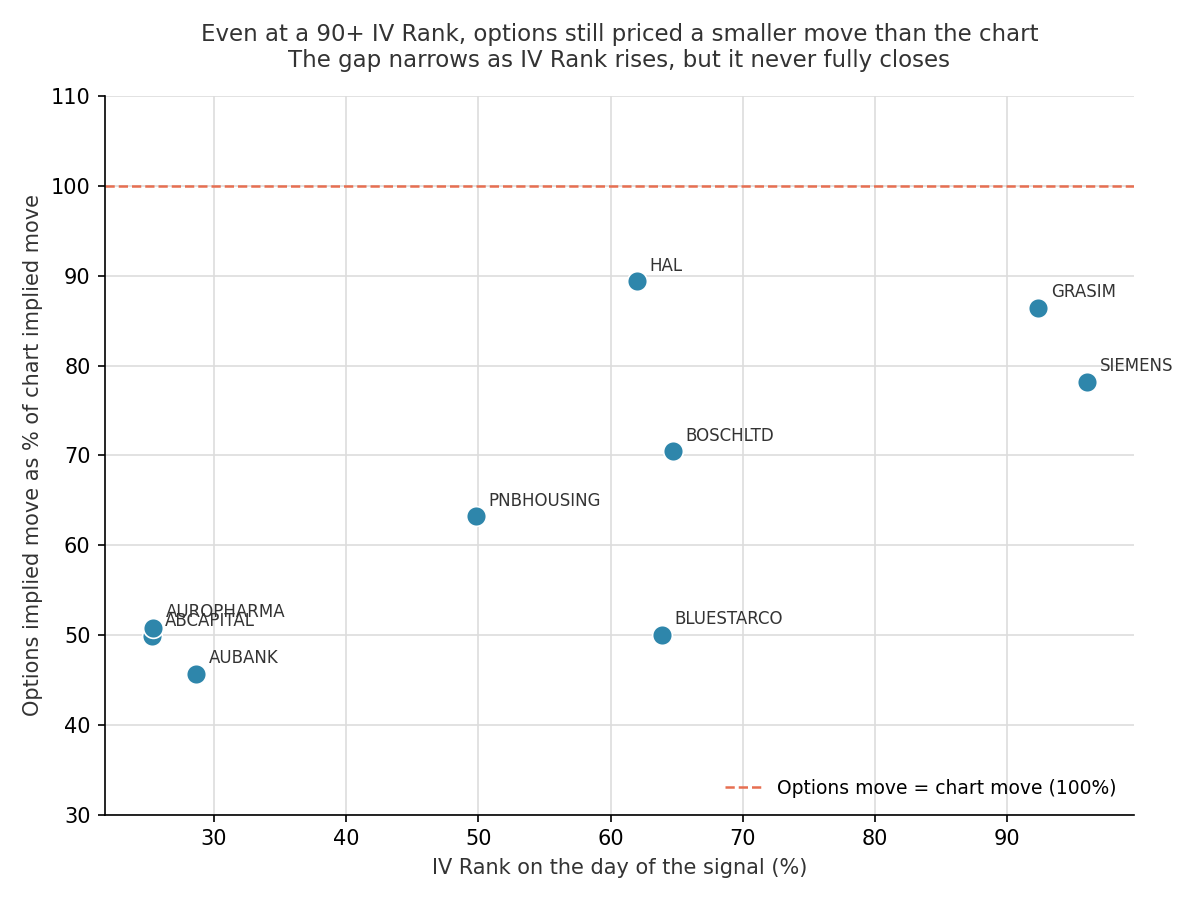
Siemens (SIEMENS) was flagged on 03 August 2026 with an IV Rank of 96.0%, meaning its options were about as expensive as they had been at any point in the past year. Grasim Industries (GRASIM) was flagged on 07 August 2026 with an IV Rank of 92.3%. Both were near the richest options pricing in their own history, and both still had options implied moves below their chart implied moves.
The gap does shrink as IV Rank rises. Hindustan Aeronautics (HAL) and Grasim Industries (GRASIM), the two names with the smallest gaps in the table, both had IV Rank above 60%. But even at 92% and 96% IV Rank, the gap never closed completely.
Two stocks that show the other side of this
This gap is a snapshot on the day of the signal, not a promise about what happens next. Bajaj Finance (BAJFINANCE) and GAIL (GAIL India Ltd) both broke out on 31 July 2026 and both kept showing up as fresh call candidates for two more sessions after that. Their charts were saying a large move was likely. Bajaj Finance (BAJFINANCE) closed at about INR 1,141 on the day of the breakout and had slipped to about INR 1,078 by 07 August 2026. GAIL (GAIL India Ltd) closed at about INR 181 on the day of its breakout and had slipped to about INR 174 by 07 August 2026. Both stocks gave back the entire breakout within a week.
So the chart implied move being larger than the options implied move is not the same as saying the stock was guaranteed to move that much. It is a read on what the stock's own recent volatility has been, not a forecast. A breakout can fade just as easily as it can extend, and late July sits inside the June and July quarter results season, when a single earnings print can undo a technical setup that had nothing to do with fundamentals.
What this means in plain terms
For an options buyer, this two week window suggests that at the money calls on names that had just broken out were priced for less movement than the stock's own recent range would justify. If the stock kept trending the way it had been, a call bought at that implied volatility was cheap relative to what actually happened.
For an options seller, the same numbers are a caution. Selling premium against a name that just cleared a fresh 252 day high, purely because the IV Rank looked reasonable, ignored the fact that the stock had been moving further than its own options were pricing in.
Neither side of this trade is free money. The chart implied move can overstate what comes next just as easily as the options implied move can understate it, especially for a stock that is already extended. What insights from bhavcopydata.com make possible is putting a number on that gap every single day, instead of guessing at it.
This was a small sample over two weeks and 13 stocks. The full daily signal list is available on bhavcopydata.com for anyone who wants to check the numbers themselves. We will keep tracking this comparison and revisit it once there is a longer run of data to see whether the pattern holds.
All figures are from NSE end of day bhavcopy data, as published on bhavcopydata.com. Follow the author at @psanivarapu or at prashanthsanivarapu for more.