We tested every pair among 227 actively traded SME stocks for correlation that a shared market move cannot explain, 25,651 pairs in total, built from 300 trading days of insights from bhavcopydata.com already computed for each stock. Almost all of them showed nothing. Two pairs stood far outside the rest, and we ran both through three separate checks meant to rule out chance and statistical artifact before trusting either number. One pair failed the second check completely. The other, M.V.K. Agro Food Products (MVKAGRO) and Polysil Irrigation Systems (POLYSIL), passed every one of them, including a permutation test that never once matched it across two hundred simulated trials.
Raw correlation is the wrong tool for a market this thin
SME stocks share a market factor the same way any stock carries a beta to its index, a segment wide mood that pushes most small caps up or down together on a given day. A plain correlation between two stocks folds that shared mood in with whatever is specific to the pair, so two stocks that simply belong to the same thinly traded segment will show a positive correlation with no real relationship between them at all. The standard fix, closer to Sharpe's single index model than a full factor regression, is to subtract a market estimate from each stock's return before comparing pairs. We used the daily cross sectional median return across all 227 stocks as that market estimate, then correlated what was left over.
market = np.median(returns, axis=1, keepdims=True)
resid = returns - market
corr = np.corrcoef(resid, rowvar=False)
Run across all 25,651 pairs, the residual correlations cluster tightly around zero, a mean of 0.0003 and a standard deviation of 0.0621. That tight, symmetric spread is the real finding of this first step. It means the market factor removal worked, most SME stocks genuinely do not explain each other's moves once the shared segment mood is taken out.
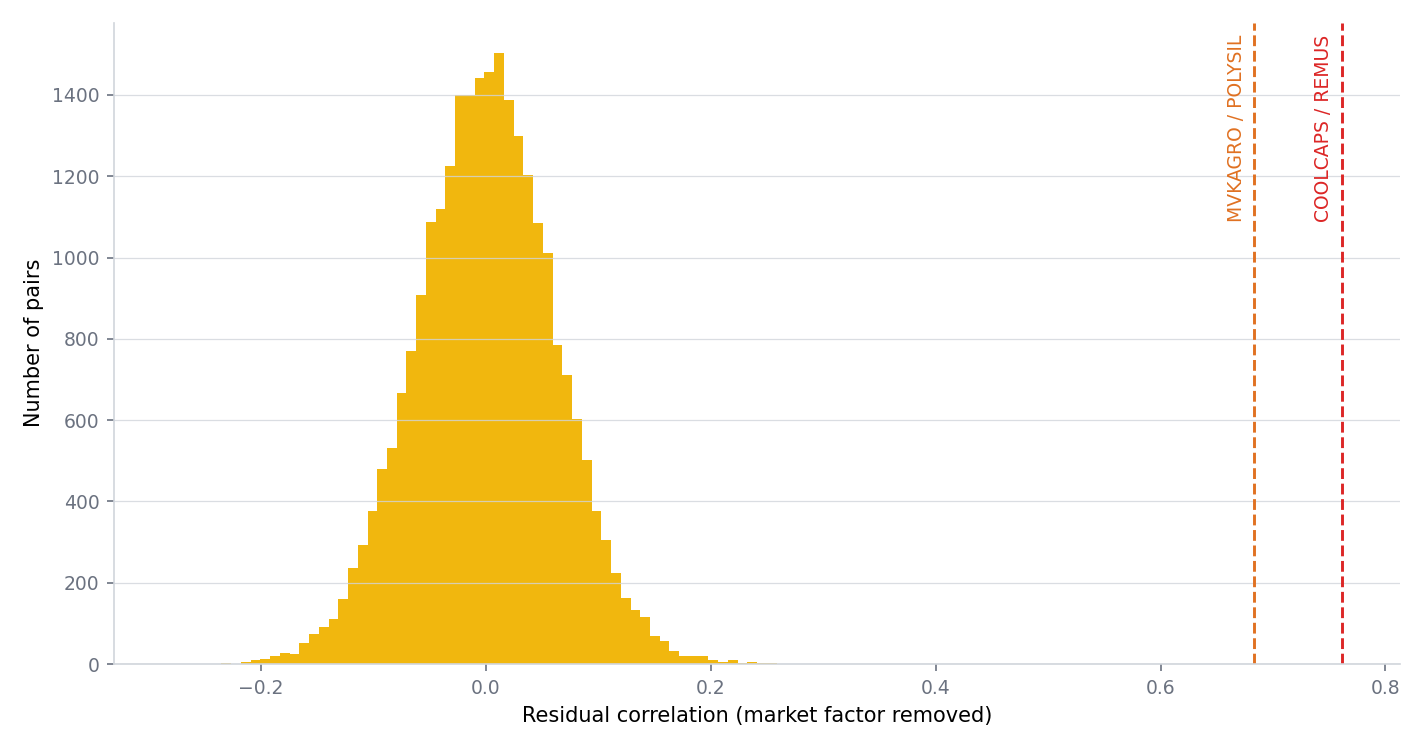
Two pairs sit well outside that spread. Cool Caps Industries (COOLCAPS) and Remus Pharmaceuticals (REMUS) come out at 0.7611, roughly twelve standard deviations from the mean. M.V.K. Agro Food Products (MVKAGRO) and Polysil Irrigation Systems (POLYSIL) come out at 0.6831, roughly eleven standard deviations out. Treated as an ordinary z score, both numbers look close to impossible by chance. That framing turns out to be the wrong one.
A permutation test shows the naive read overstates the finding
Twelve standard deviations sounds definitive, but that number compares one pair against the spread of a single random pair, not against what the largest of 25,651 comparisons should look like by chance. Testing that many pairs at once is a multiple comparison problem, the same one that shows up in genome wide association studies or any large scale statistical screen. The correct benchmark is the distribution of the maximum across all the trials run, not the distribution of one trial. We built that benchmark directly from the data with a permutation test, shuffling the trading day order for each stock's residual return independently, which destroys any real relationship between stocks while keeping each stock's own return pattern intact, then recomputing the full correlation matrix and recording only its highest value.
for _ in range(200):
    shuffled = np.column_stack([rng.permutation(col) for col in resid.T])
    perm_max = np.corrcoef(shuffled, rowvar=False)[iu].max()
Two hundred repeats gave an empirical distribution for the maximum correlation expected from 227 unrelated return series with 299 daily observations each. The permutation maxima averaged 0.3230 with a standard deviation of 0.1299, and reached as high as 0.9049 in a single trial. Against that benchmark, a maximum this large is not rare. Our observed 0.7611 was matched or exceeded by 2% of the two hundred trials, and 0.6831 by 3.5% of them. The twelve sigma framing from the first section overstated how unusual these numbers actually are once the number of comparisons is accounted for properly.
Rank correlation exposes one pair as an artifact of a few outlier days
A permutation test on ordinary Pearson correlation inherited another weakness. Pearson correlation is sensitive to a handful of extreme days, and this SME panel has them. The single largest move in the entire panel is one session where a stock's closing price rose more than ninefold, almost certainly an unadjusted corporate action rather than a real trading move. Daily moves beyond 15% happen on about four in every thousand stock days across the 227 names. A pair whose correlation is driven mostly by one or two shared extreme days will look strong under Pearson correlation and say very little about how the two stocks actually move on an ordinary day.
Spearman rank correlation, which only cares about the order of returns and not their size, is the standard check against exactly that failure mode. Recomputed in rank space, COOLCAPS and REMUS drop from 0.7611 to negative 0.0692, indistinguishable from the rest of the market. The entire signal came from a small number of outsized days, not from a real relationship. MVKAGRO and POLYSIL barely move, from 0.6831 in Pearson correlation to 0.6673 in Spearman correlation, the highest of all 25,651 pairs by rank correlation.
Rerunning the permutation test in rank space gives a cleaner benchmark, since it is no longer distorted by the same outlier days. Two hundred rank based permutation trials produced a maximum correlation that topped out at 0.279, well below the 0.6673 actually observed for MVKAGRO and POLYSIL. None of the two hundred trials came close.
The surviving pair holds up across fourteen months of rolling windows
A correlation measured once over a full window can still be misleading if it comes from a single stretch rather than a persistent pattern, the same reason a single quarter's return says little about a fund's actual skill. We split the 300 day window into fourteen 20 day blocks that do not overlap and recomputed the same residual Pearson correlation from the first section separately in each block.
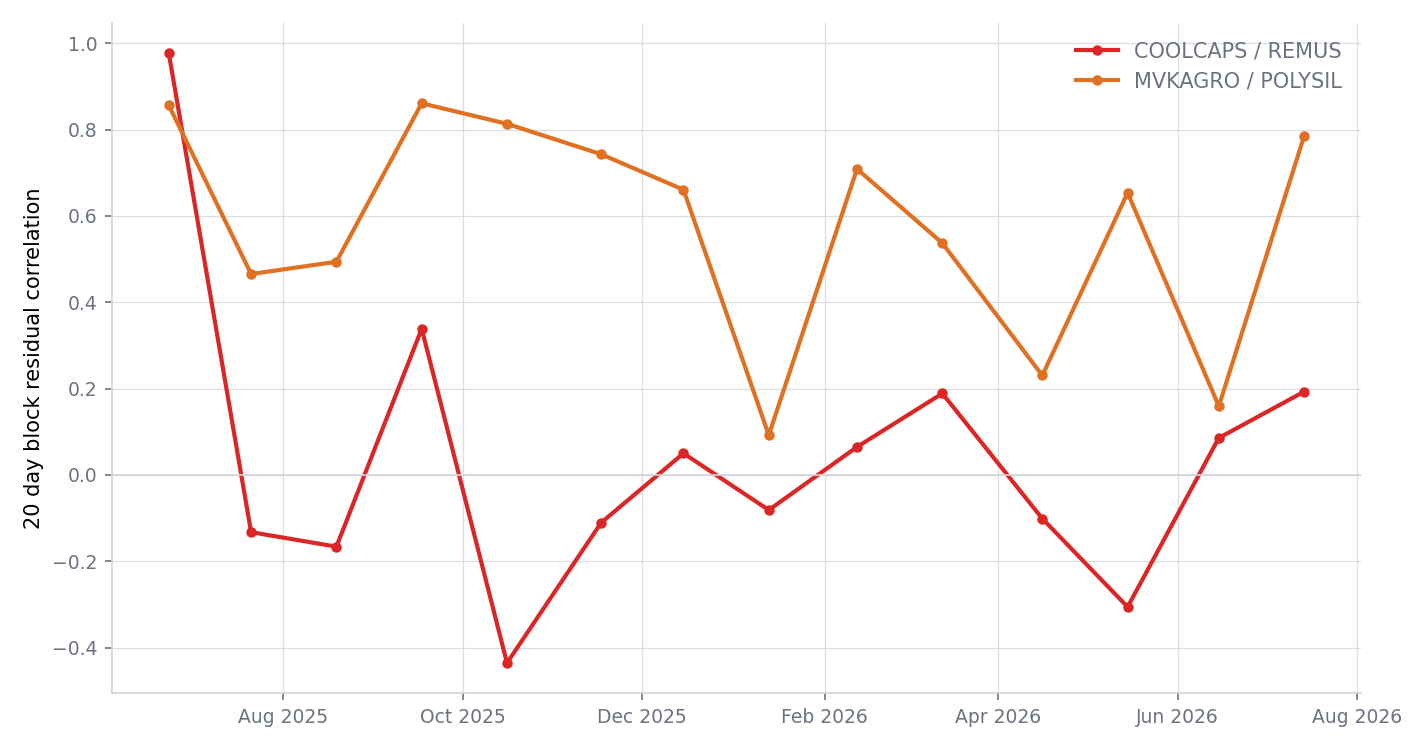
COOLCAPS and REMUS confirm the rank correlation finding here too. Only the first block, in late June 2025, shows a strong reading at 0.977. Every block after that sits close to zero, seven of the remaining thirteen negative, and the two stocks move in the same direction on only 46.8% of trading days across the full window, worse than a coin flip. MVKAGRO and POLYSIL show the opposite pattern entirely. All fourteen blocks come out positive, ranging from 0.092 to 0.861, and the two stocks move in the same direction on 77.9% of trading days over the full ten and a half months.
What nineteen of the last twenty sessions looked like
The statistics above describe a pattern. The daily data shows what it looks like in practice.
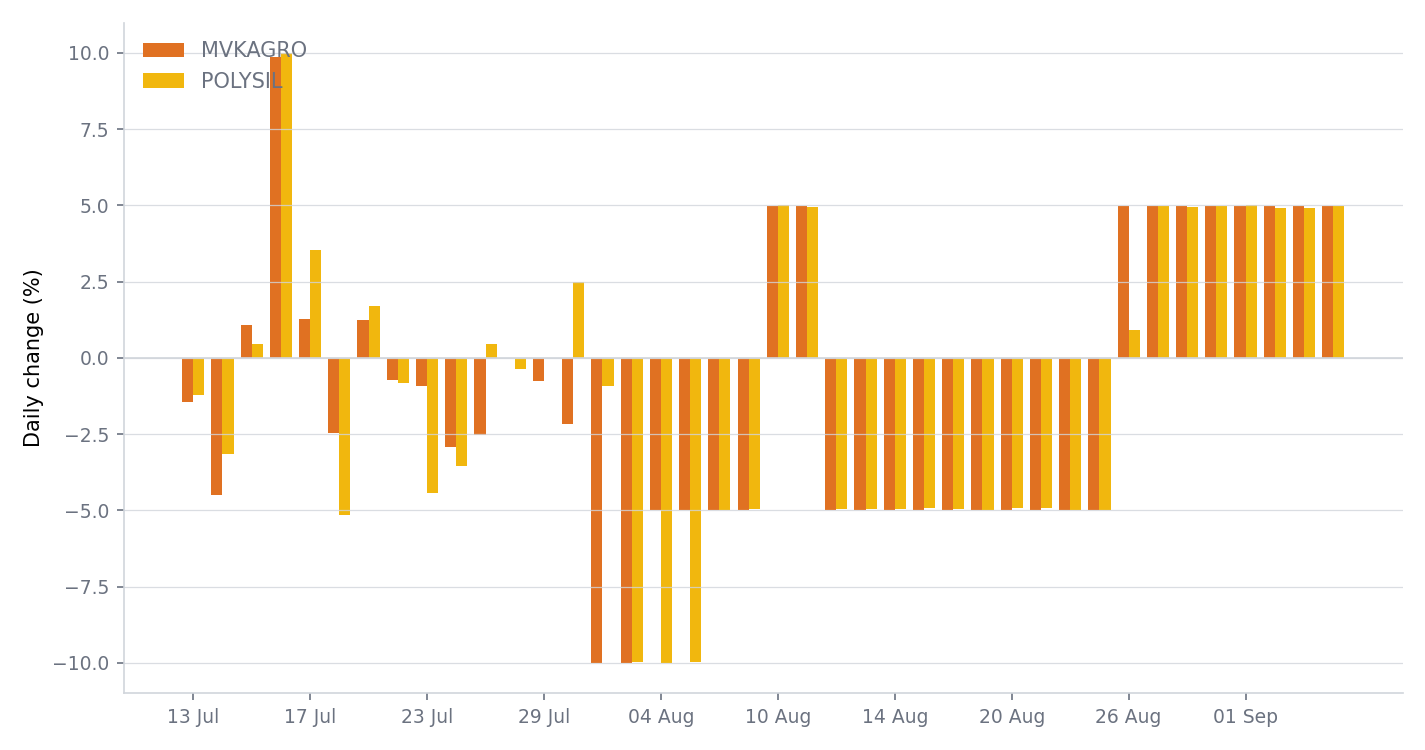
Over the last 20 trading sessions, MVKAGRO and POLYSIL moved in the same direction on all 20 days, and on 19 of those days closed within a tenth of a percentage point of each other's daily price band move. The one session where the exact match broke, 26 August, was also the heaviest combined trading day of the stretch for both names. MVKAGRO traded about INR 23.9 crores and POLYSIL about INR 3.1 crores that day, each stock's largest single day turnover in the entire window, even as the exact percentage match slipped for that one day only.
What this correlation does and does not establish
A correlation this strong, this persistent, and this resistant to every check above is a genuine statistical pattern, not the kind of coincidence a permutation test or a rank correlation check would have exposed. It is not evidence of coordination, common ownership, or intent, none of which a price series can establish on its own. Boring explanations exist too. A shared sector, a common supplier or customer, or simply the mechanics of two thinly floated stocks that both tend to hit their price band once trading starts moving in one direction, could explain it just as well. What the data shows is that MVKAGRO and POLYSIL have moved together far more often than 225 other actively traded SME stocks on bhavcopydata.com, consistently, for most of the last year, a pattern the site's own insights did not surface until this correlation was tested directly. Nothing here is investment advice, and nothing here says why.
All figures are from NSE end of day bhavcopy data, as published on bhavcopydata.com. Follow the author at @psanivarapu or at prashanthsanivarapu for more.