Delta, gamma, theta and vega are usually taught as formulas on a whiteboard. We wanted to see how they behave with real prices. So we calculated them for every traded NIFTY 50 (NIFTY) option with the data on bhavcopydata.com. That covers 344 trading days, from 30 June 2025 to 20 November 2026, and 161,948 contract days with a usable price. Then we checked each greek against what the options actually did the next day.
Three findings stand out. The market charged more for downside protection than for upside bets on every single day in the sample. Time decay was gentle for weeks and then very fast in the final few sessions. And the textbook delta predicted next day option prices well, but with a consistent error that the skew explains.
How we got the greeks from end of day data
NSE's bhavcopy does not publish implied volatility or any greek. It publishes each option's closing price, strike, expiry and the underlying's close. That is enough to work everything else out in two steps.
The first step is the forward price for each expiry, the price of NIFTY for delivery on that expiry date. Only a few NIFTY expiries have a matching futures contract, so we used put call parity instead. A call minus a put at the same strike, grossed up for interest, plus the strike, gives the forward.
# forward from put call parity, one estimate per strike near the money
F = K + np.exp(r * T) * (call_close - put_close)
forward = np.median(F)
Where a futures contract did exist, we compared the two. Across 673 matching dates and expiries, the parity forward sat a median of 0.019% away from the futures close, about 4.9 index points. That is close enough to trust the parity forward for every expiry.
The second step is implied volatility. We searched for the volatility that makes the Black 76 option pricing model reproduce each option's closing price, then computed delta, gamma, theta and vega from it. Black 76 is a standard model published by Fischer Black in 1976 for options on forwards. It is an outside input, not something in the data.
Three choices shape the results, and we state them here once. We assumed a risk free rate of 6.5%; it only discounts the payoff and moves the results very little. We dropped every contract with zero trades on the day, which was 28.8% of the rows we pulled. Every one of those had a closing price different from its NSE settlement price, so their prices are not real trades. We also kept only options with at least 50 trades on the day, a price of at least INR 0.50 and a strike within 8% of the forward.
Vega and the skew, puts cost more than calls every day
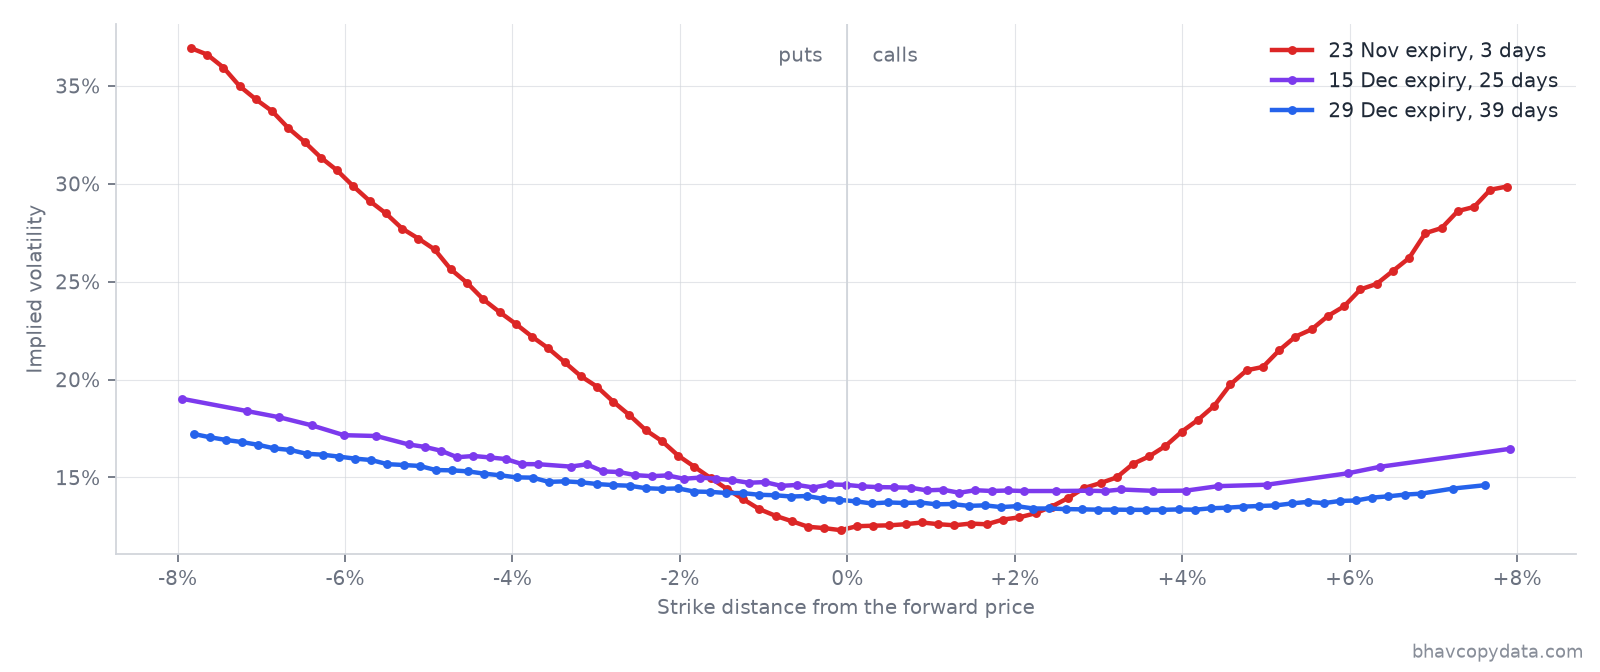
Vega is how much an option's price changes for each one point change in implied volatility. The chart shows what that volatility looked like across strikes on Friday 20 November 2026, with India VIX at 17.32.
For the 23 November expiry, 3 days out, at the money implied volatility was 12.39%. A put 3% below the forward was priced at 19.66%, while a call 3% above it was priced at only 14.68%. At 5% away the gap was 26.85% for the put against 20.80% for the call. The 23,750 put traded 17,929 times at INR 2.00, an implied volatility of 36.93%, three times the at the money level. Longer expiries had a flatter curve that still tilted toward puts. For 29 December, 39 days out, volatility ran from 15.47% at the 5% put, through 13.82% at the money, down to 13.56% at the 5% call.
The tilt never reversed. We compared a put 3% below the forward with a call 3% above it on the front expiry between 15 and 45 days out, for every day in the sample. The put carried the higher implied volatility on all 344 days, by an average of 2.25 points. The gap was widest at 6.89 points on 9 March 2026 and narrowest at 0.12 points on 11 November 2026. It also moved with fear in the market, with a correlation of 0.72 against India VIX. At the money implied volatility tracked India VIX almost exactly, with a correlation of 0.99. That is expected, since NSE's published India VIX methodology builds the index from NIFTY option prices; that fact comes from NSE's documentation, not from the bhavcopy data.
For a buyer of protection this is a real cost. A put 3% out of the money carried 2.25 more volatility points on average than the matching call, so a buyer paid for more volatility at the same distance from the forward. The delta section below shows why sellers demanded that premium.
Theta, slow for weeks and then very fast
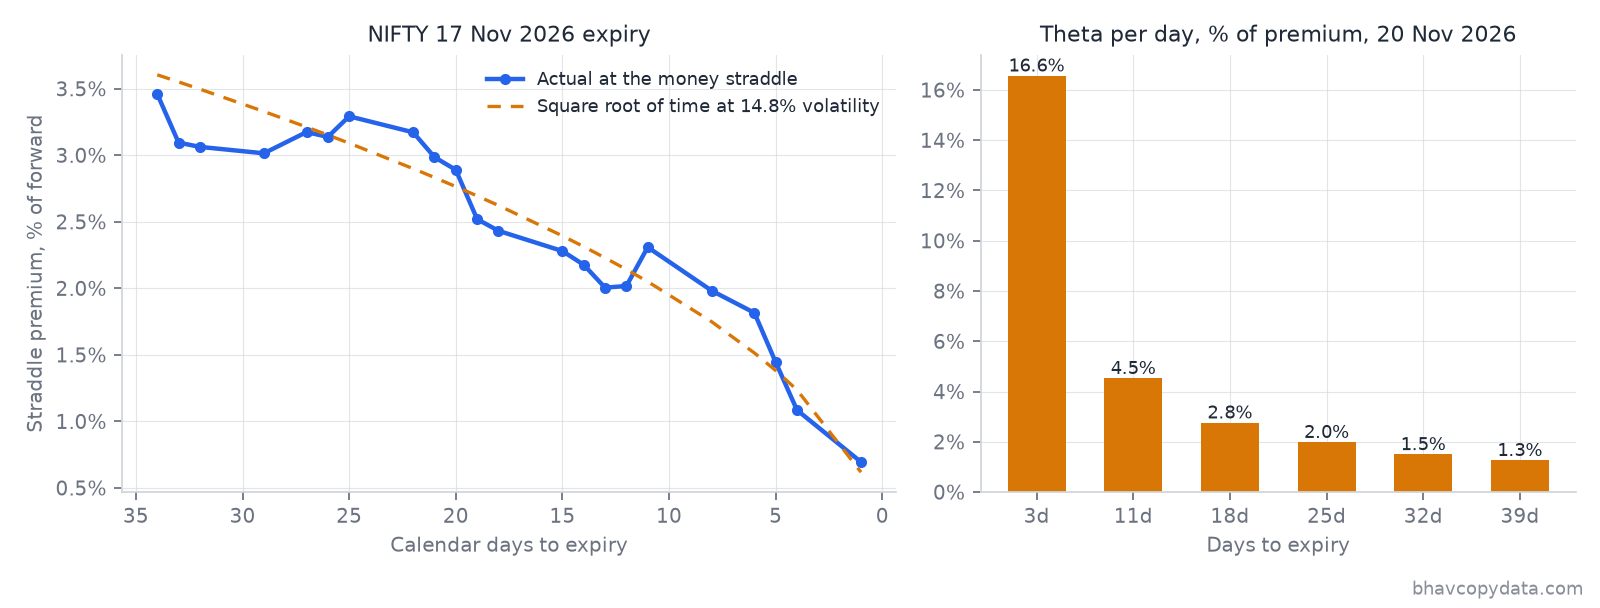
Theta is the value an option loses each day if nothing else changes. NIFTY's many weekly expiries let us compare options of different ages on the same day. On 20 November 2026 we priced the at the money straddle, one call plus one put at the strike nearest the forward, for each expiry.
| Days to expiry | Straddle price | Implied volatility | Theta per day | Theta as % of premium |
|---|---|---|---|---|
| 3 | INR 231.90 | 12.42% | INR 38.41 | 16.56% |
| 11 | INR 514.60 | 14.43% | INR 23.30 | 4.53% |
| 18 | INR 674.45 | 14.77% | INR 18.61 | 2.76% |
| 25 | INR 784.30 | 14.59% | INR 15.54 | 1.98% |
| 32 | INR 883.35 | 14.36% | INR 13.23 | 1.50% |
| 39 | INR 927.35 | 13.82% | INR 11.72 | 1.26% |
The 3 day straddle cost a quarter of the 39 day one, yet lost more than three times as many rupees per day. Measured against its own price, it was losing 16.56% a day, compared with 1.26% for the 39 day contract.
The left side of the chart follows one expiry, 17 November 2026, through its life. On 14 October, 34 days out, the at the money straddle cost 3.46% of the forward, INR 786.45. By 30 October, 18 days out and roughly halfway to expiry, it still cost 2.43%, which is 70% of its starting value. The final stretch went much faster. The straddle fell from 1.09% of the forward with 4 days left to 0.70% with 1 day left. Model theta rose from INR 10.80 a day at the start to INR 87.36 a day on the last full session.
The dashed line is a common rule of thumb, which says an at the money straddle is worth about 0.8 times volatility times the square root of time. It comes from option pricing theory, not from this data. At the expiry's average implied volatility of 14.8%, it follows the real straddle closely. Time decay follows the square root of time. Half the time to expiry leaves about 71% of the premium, not 50%.
Vega and theta also worked against each other here. On 6 November the straddle rose from 2.02% to 2.31% of the forward even though a day had passed, because implied volatility jumped from 13.97% to 16.70% that session.
Delta and gamma, tested against next day prices
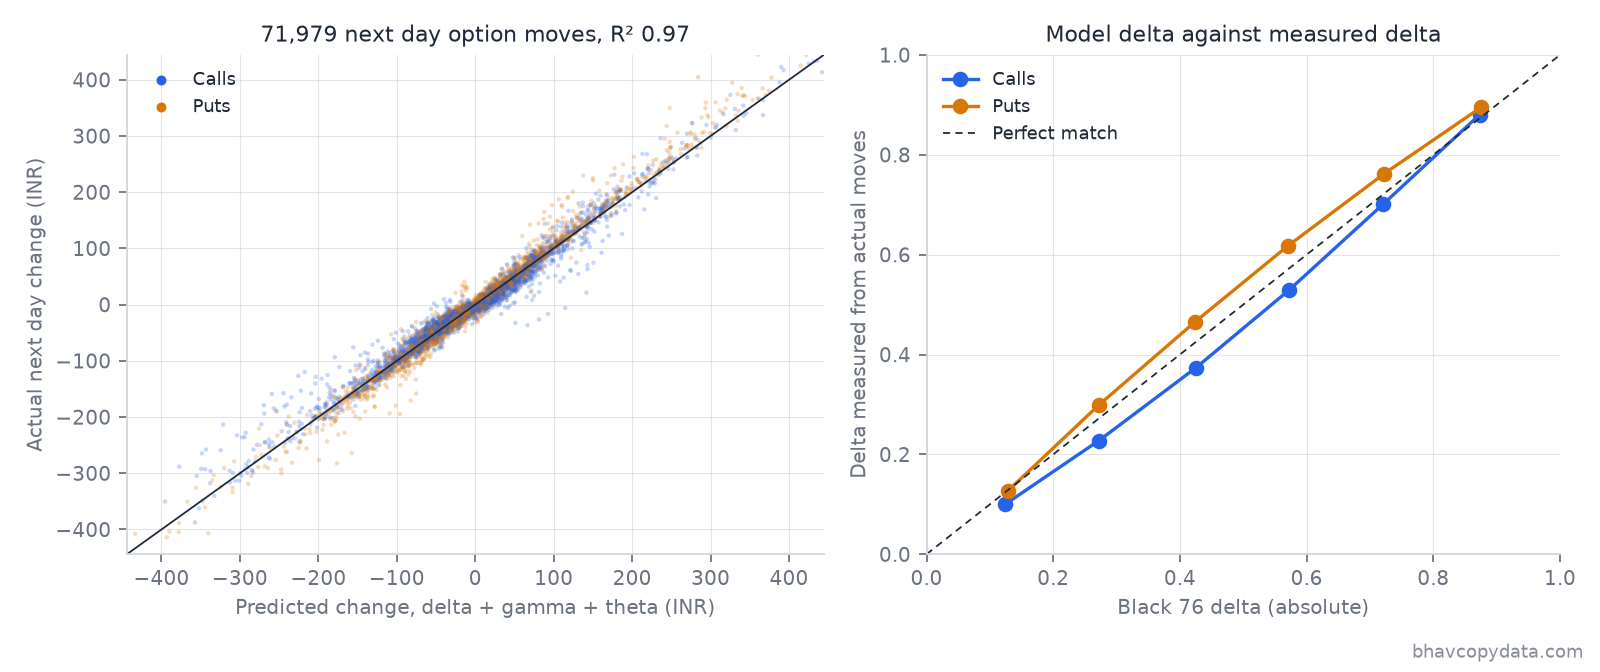
Delta says how much an option moves for each one point move in the underlying. Gamma says how fast delta itself changes. To test them, we took every option that traded at least 200 times on two consecutive trading days. Each option also had to cost at least INR 5, be 3 to 45 days from expiry, and have a strike within 4% of the forward. That gave 71,979 pairs of days across 7,391 contracts. For each pair we predicted the next day price change from the previous day's greeks and compared it with what happened.
predicted = delta * dF + 0.5 * gamma * dF**2 + theta * days
r2 = 1 - ((actual - predicted)**2).sum() / ((actual - actual.mean())**2).sum()
Delta alone explained 94.2% of the variation in next day option price changes, an R squared of 0.942. Adding gamma raised that to 0.963, and adding theta to 0.974. Gamma mattered most on large moves. On the 12,203 pairs where the forward moved more than 1%, delta alone explained 93.6% and delta plus gamma explained 97.3%.
The largest fall in the sample shows why. From 18 to 19 March 2026 the NIFTY forward fell 755.8 points, or 3.17%. Across that day's 253 pairs, delta alone explained 86.7% of the price changes, and adding gamma raised it to 98.8%. One example is the 23,800 put for the 30 March 2026 expiry, which rose from INR 305.20 to INR 836.95, a gain of INR 531.75. Its delta of 0.503 (negative, as for every put) predicted a gain of only INR 365.06. With gamma and theta included the prediction was INR 494.11. The put picked up delta as the market fell through its strike, and delta alone missed that.
Where delta was consistently wrong, and why the skew explains it
The right side of the chart shows the more useful finding. We grouped options by their model delta and measured their real delta from the price moves, after removing gamma and theta. Calls moved less than the model said. A call with a model delta of 0.425 had a measured delta of 0.373, and one at 0.124 measured 0.100. Puts moved more. A put with a model delta of 0.423 measured 0.465, and one at 0.272 measured 0.299. The two converged for deep in the money options, 0.873 against 0.881 for calls and 0.875 against 0.895 for puts.
Implied volatility explains the pattern, because it did not stay still when NIFTY moved. On the 30 days NIFTY fell more than 1%, at the money implied volatility rose by a median of 1.10 points. On the 25 days it rose more than 1%, implied volatility fell by a median of 0.17 points. Across all 343 days the two moved in opposite directions, with a correlation of minus 0.47. On average, each 1% fall in NIFTY came with about 0.56 points more implied volatility.
That changes how each option behaves. When NIFTY falls, a put gains from delta and gains again through vega, as implied volatility rises. A call loses from delta but the same rise in implied volatility cushions the loss. So puts look more sensitive to the market than the model says, and calls look less sensitive. Adding vega, using each option's actual change in implied volatility, raised the R squared from 0.974 to 0.989.
This is the same behaviour the skew prices in advance. Sellers charge more volatility for puts because those puts gain in value fastest in exactly the falls that hurt sellers most. A trader who hedges a short at the money NIFTY call with its textbook delta of 0.43 would, on this history, have held about 14% more futures than the call's real sensitivity of 0.37 required.
The daily options chain, open interest and put call ratios behind this analysis are on the Options page, with more insights from bhavcopydata.com updated every trading day. For related insights comparing implied volatility with recent price ranges in stock options, see Options on Breakout Stocks Are Pricing in Smaller Moves Than the Charts Suggest.
All figures are from NSE end of day bhavcopy data, as published on bhavcopydata.com. Follow the author at @psanivarapu or at prashanthsanivarapu for more.