Two weeks ago it looked like the US and India bond markets were diverging (pulling apart). The US 10 year Treasury yield fell to about 4.64% by 25 August, three days before Fed Chair Kevin Warsh's own Jackson Hole speech, pulled down by a report that the Treasury could tap its General Account to help fund bond buybacks and by a slide in oil prices. India's 10 year yield kept rising the whole time, on hawkish signals from the Reserve Bank of India and a heavy bond supply calendar. That gap did not last. Warsh's 28 August speech kept the focus on inflation and gave markets no rate cut signal to hold onto, and the US 10 year yield climbed through the rest of the week. By 2 September it was back up to 4.79%, according to the Federal Reserve's H.15 release, and the August jobs report pushed it further. Nonfarm payrolls rose by 162,000 against a forecast of 53,000. The US Bureau of Labor Statistics said, the unemployment rate held at 4.1% and average hourly earnings rose 3.1% over the year. Odds of a rate hike, not a cut, at the 17 September Fed meeting rose to about 59% on the report, up from 52% earlier. We used insights from bhavcopydata.com to see where India's debt exchange traded funds sit after two weeks in which both countries' yields moved higher, for different reasons, and the long end of India's gilt market never recovered.
The rate cut story did not survive the data
A weak July payrolls report had left markets hoping for a dovish tone from new Fed Chair Kevin Warsh's first Jackson Hole speech, and yields eased in the days before he spoke.
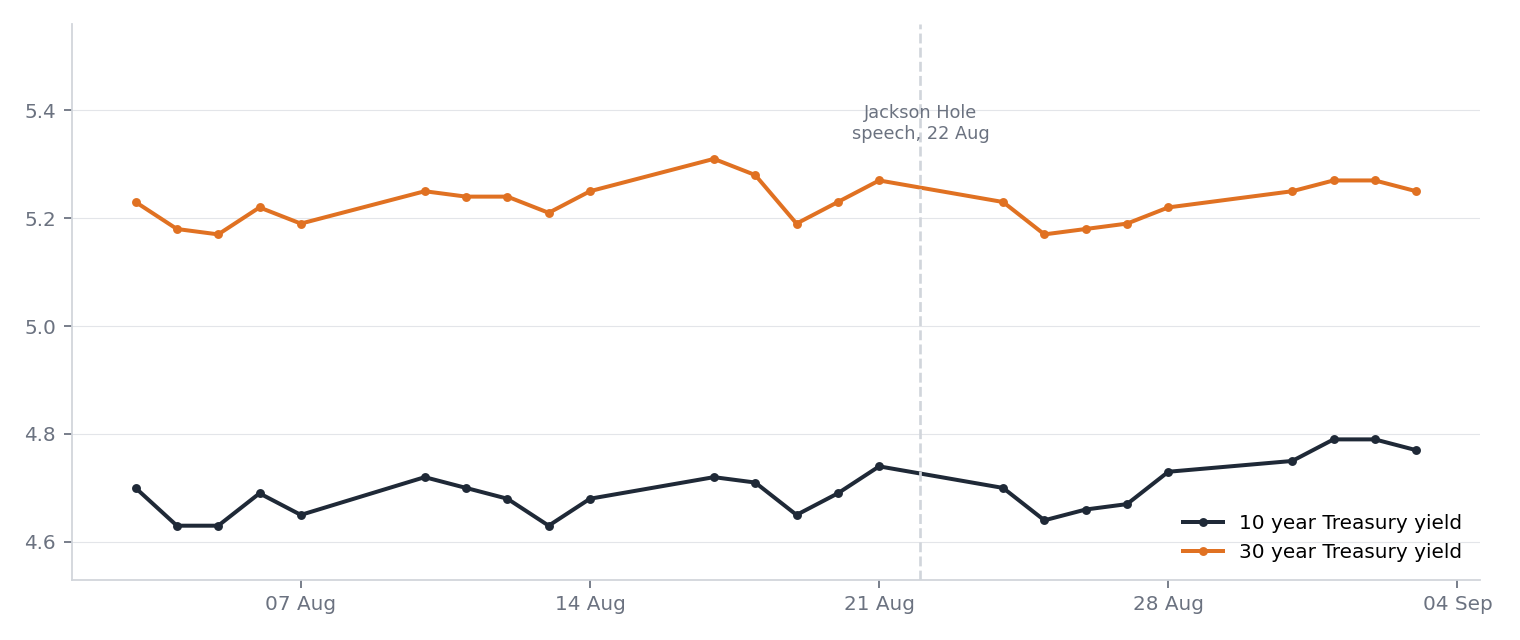
Chart data, daily 10 year and 30 year Treasury constant maturity rates, from Federal Reserve Economic Data (FRED), series DGS10 and DGS30, sourced from the Federal Reserve's own H.15 release.
The dip had two specific triggers, not the speech itself. On 24 August, yields fell on a report that the Treasury could tap its General Account to help fund a ramp-up in bond buybacks. On 25 August, yields fell further as oil prices slid, with the 10 year down to 4.64%, its low point for the stretch shown here. Both moves happened while the market was still waiting for Warsh to actually speak. When he did, on 28 August, Warsh kept the focus on inflation, said summer readings had come in better than expected but underlying trends had not meaningfully improved, and pointedly avoided giving forward guidance on rate cuts, telling the audience the market should not look to the Fed for its next trade. Yields turned higher from there. The 10 year climbed to 4.79% and the 30 year to 5.27% by 1 September, both above where they stood at the start of this two-week stretch. The August jobs report added to the move, a gain of 162,000 jobs, the strongest since March, arriving alongside inflation still running above the Fed's target, which is why the market reaction was a jump in yields and a stronger dollar rather than a rally in bonds.
India's own hawkish story keeps building on top of a fresh oil shock
The RBI's Monetary Policy Committee held its policy stance at its August review, according to minutes published in the middle of the month, with retail inflation above the 4% target in June on higher food prices.
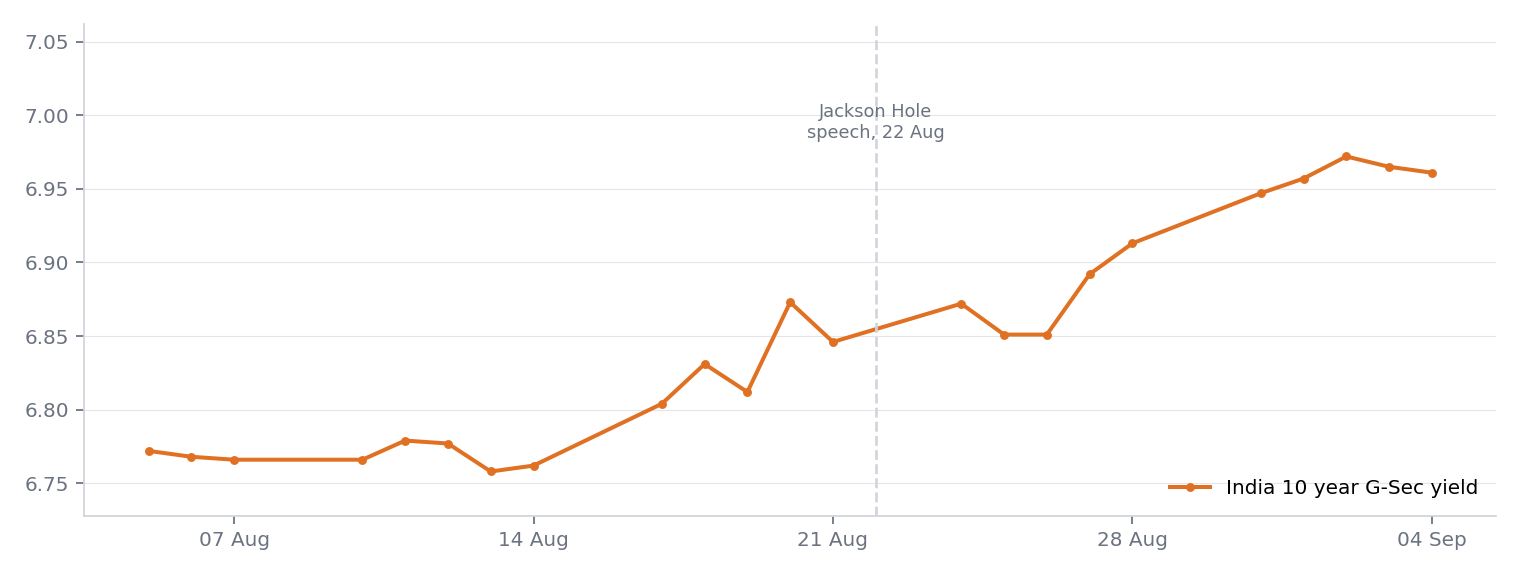
Chart data, daily India 10 year government bond yield, from Investing.com's India 10 Year Bond Yield historical data.
The chart shows no dip anywhere near the speech but a steady climb that barely paused. The yield peaked at 6.97% on 2 September, before easing slightly to 6.96% by 4 September. Two forces are stacked on top of each other now. Two things are pushing this. First, traders now expect the RBI to raise rates sooner than later. Second, Brent crude has climbed above 95 US dollars a barrel after fresh US strikes on Iran raised fears of disruption through the Strait of Hormuz. India buys more than 80% of its crude oil from abroad. So a sustained rise in oil prices add to the inflation and rupee concerns that have kept RBI cautious all year.
Thirty three of the site's debt ETFs are liquid enough to trust, and they split by duration
Data on bhavcopydata.com currently tracks 46 exchange traded funds in the Debt category but many trade too thin to be read as a real price signal. 33 of the 46 carry a High or Medium liquidity badge, and 29 of those sort cleanly into four duration groups:
- Liquid or overnight, 20 funds, hold effectively no duration
- Five year gilt, 2 funds, track a five year gilt index
- Target maturity, Bharat Bond, 5 funds, each holding a fixed basket that matures on a set date
- 8 to 13 year gilt, 2 funds, track the Nifty 8 to 13 Year G-Sec Index
The remaining 4 sit outside the groups mentioned above. A mix of corporate bond, state development loan and single named gilt funds. They are left out of the table below rather insted of being forced into a bucket they do not fit.
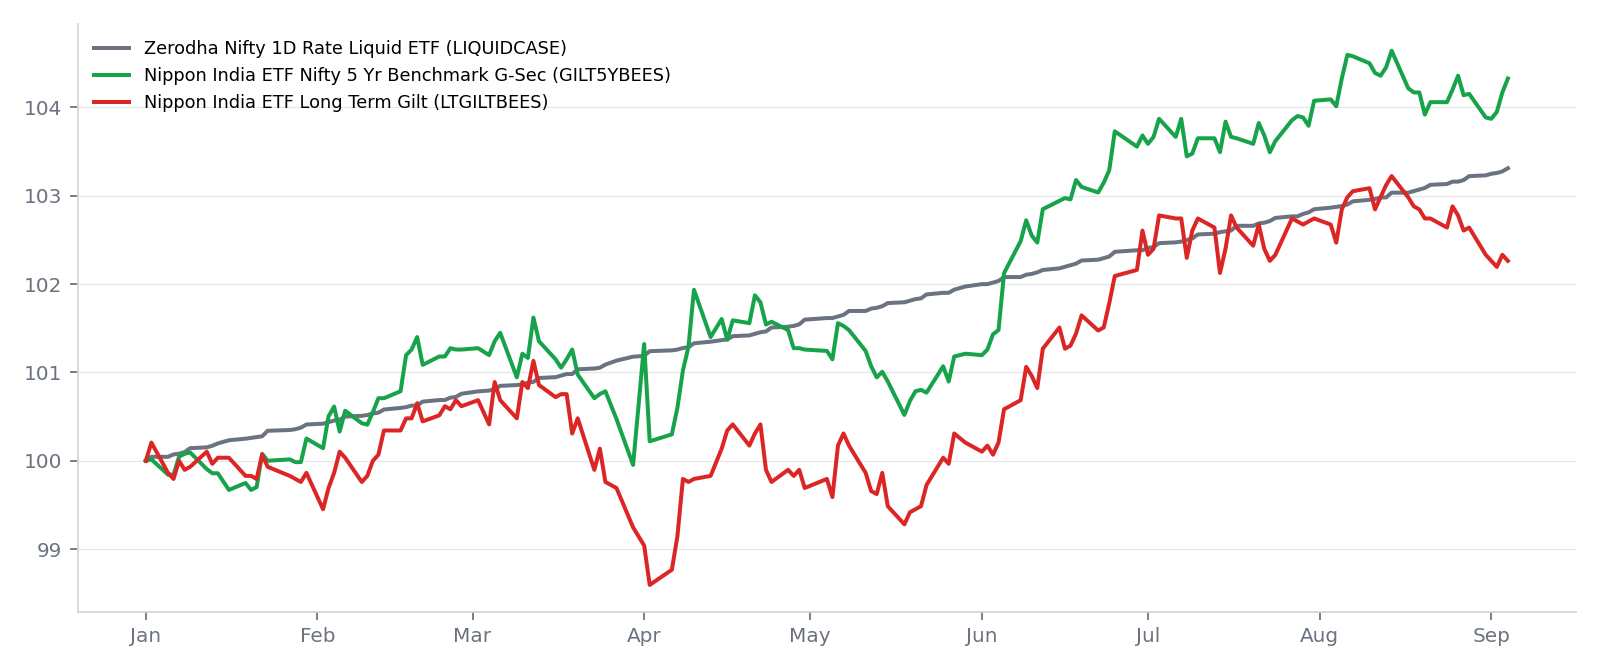
We indexed three representative funds to 100 on 2 January 2026, the Zerodha Nifty 1D Rate Liquid ETF (LIQUIDCASE) at effectively zero duration, the Nippon India ETF Nifty 5 Year Benchmark G-Sec (GILT5YBEES) at moderate duration, and the Nippon India ETF Long Term Gilt (LTGILTBEES) at the longest duration with the steadiest volume. Both gilt funds fell in April and rallied through June and July as India's rate expectations eased earlier in the summer. From early August they split. GILT5YBEES pushed to a fresh high near 104.3 on the indexed scale by early September. LTGILTBEES peaked in mid August, then rolled over, closing at 29.84 on 4 September against 29.95 a week earlier.
Liquid funds kept gaining while long term gilt funds kept losing ground
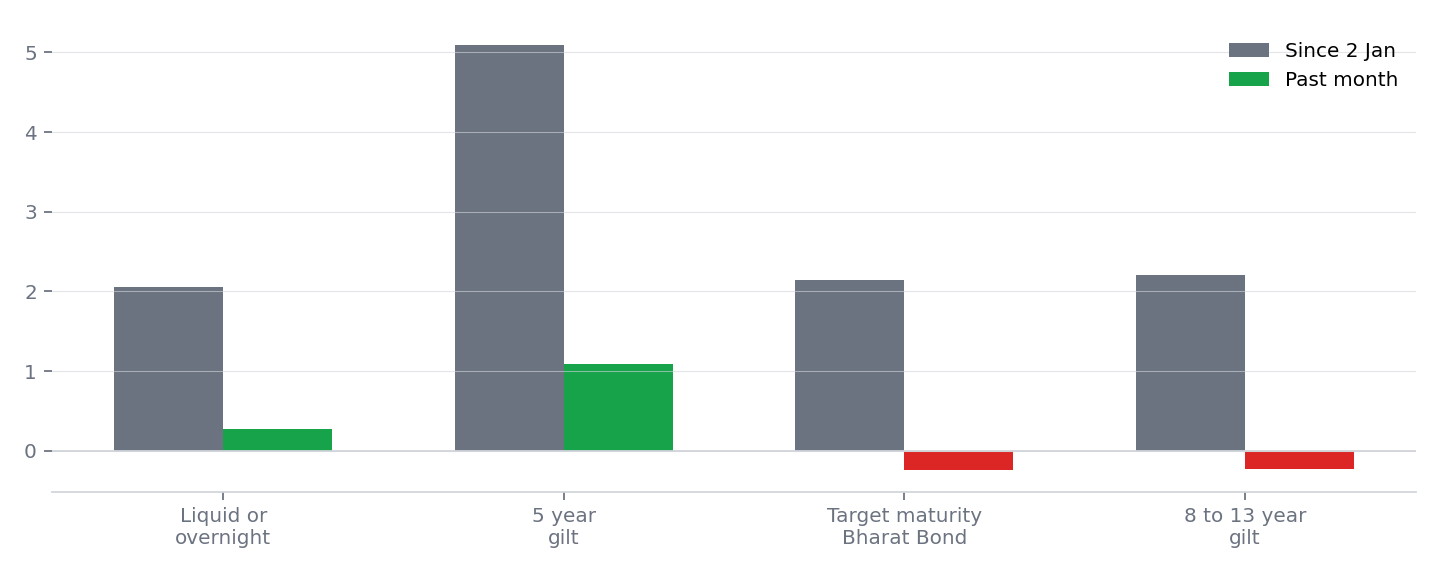
| Duration bucket | Funds | 2 Jan to 4 Sep | Past month | Past week |
|---|---|---|---|---|
| Liquid or overnight | 20 | +2.05% | +0.27% | +0.06% |
| 5 year gilt | 2 | +5.09% | +1.09% | +0.41% |
| Target maturity, Bharat Bond | 5 | +2.15% | −0.24% | +0.14% |
| 8 to 13 year gilt | 2 | +2.20% | −0.23% | −0.40% |
If rising yields explained everything, every duration bucket beyond the liquid funds should be losing ground by now. Instead the five year gilt bucket is up 1.09% over the past month, while both the Bharat Bond and the long gilt buckets turned negative over the same period. Demand for medium tenor government paper has remained consistent even as the long end of the yield curve absorbs the supply and inflation worry.
The 52 week extremes on the site tell the same story from a different angle. The Shriram Nifty 1D Rate Liquid ETF (LIQUIDSHRI) has made four fresh 52 week highs since 17 August, most recently on 4 September at 1,120.33, on its heaviest turnover of that run, about INR 2.32 crores. The DSP Nifty 10 Year Benchmark G-Sec ETF (GSEC10ADD) has made four fresh 52 week lows over the same stretch, most recently on 1 September at 26.49. A liquid fund at a new high and a 10 year gilt fund at a new low, in the same week where India's 10 year yield pushed to 6.96%.
Corporate bonds still do not show the same clean pattern
We also checked India's corporate bond market for the same signal.
| Bond (symbol) | Issuer | Type | 90 day turnover | Price change since 2 Jan |
|---|---|---|---|---|
| 905SCL36 | Shriram Finance | Private | INR 20.14 crores | Not available (no January price) |
| 830NHAI27 | NHAI | Tax free | INR 12.94 crores | +3.45% |
| 76NHAI31 | NHAI | Tax free | INR 11.59 crores | −3.89% |
| 96IIFL28A | IIFL Finance | Private | INR 11.24 crores | +0.48% |
| 82HUDCO27 | HUDCO | Tax free | INR 11.21 crores | −4.37% |
| 96IIFL28 | IIFL Finance | Private | INR 10.32 crores | +0.43% |
| 871REC28 | REC | Tax free | INR 8.88 crores | +2.60% |
| 875NHAI29 | NHAI | Tax free | INR 8.76 crores | −6.81% |
| 901NHB34 | NHB | Tax free | INR 6.29 crores | +2.12% |
| 890AEL31 | Adani Enterprises | Private | INR 6.25 crores | Not available (no January price) |
Six of the ten are tax free bonds from NHAI, HUDCO, REC and NHB; the other four are newer private issues from IIFL Finance, Adani Enterprises and Shriram Finance. Among the eight with a valid January price, changes range from a gain of about 3.45% to a loss of about 6.81%. That is not a contradiction of the ETF pattern. It is the same point bhavcopydata.com's own analysis has made before, that individual corporate bonds on the exchange trade thinly and that their closing prices are set by whichever quote cleared that day. A pattern documented in our earlier look at quote alternation in corporate bonds. Exchange traded gilt funds are priced continuously against the same underlying index and kept in line by market makers, which is why they register a curve shaped move far more cleanly than any single bond does.
What this means for anyone holding these funds
A saver in the Nippon India ETF Long Term Gilt (LTGILTBEES) has now watched three weeks of decline stacked on top of the mid August peak, purely from a change in market yield at the long end. A saver in the Nippon India ETF Nifty 5 Year Benchmark G-Sec (GILT5YBEES) has had the opposite few weeks, new highs through the same stretch. A saver in an overnight liquid fund saw neither move, just a steady climb from daily interest accrual. All of these sit in the same Debt category on the site, and the gap between them only shows up once yields actually move by tenor rather than as one number.
What it says about the two economies
The story from two weeks ago was a clean divergence. US yields easing on rate cut hopes, India's rising on a hawkish RBI. That gap has closed, but not because the two economies converged. The US move was a round trip of its own kind. A Treasury buyback report and falling oil prices pushed the 10 year yield down to its lowest point on 25 August, days before Warsh even spoke. His speech gave markets nothing dovish to hold onto, yields climbed back above their prior level within a week, and then a jobs report today was strong enough to put a rate hike back on the table. India's move has been closer to a straight line. A central bank unwilling to call one hot inflation print decisive, a bond market pricing tighter policy anyway, and now an oil shock from outside India's own control. Both countries' yields sit higher than they did in late August.
How the yields go there matters for what comes next. A yield that rises because growth data forced out a rate cut bet is a different signal from a yield that rises because a war risk premium got priced into oil. The first tends to fade once the data cycle turns. Its yield low lasting only until 25 August before climbing back within a week. The second depends on events outside the central bank's control. India's long gilt ETFs sliding while its five year gilt ETFs climb is a market telling you it is more confident about the next few years than it is about the next ten, and that reading did not change today.
Full debt ETF data, including every fund mentioned here, is on the ETF page, and the underlying corporate bond data is on the Corporate Bonds page. More insights are on bhavcopydata.com.
Further reading and data sources for the figures and charts above, from the Federal Reserve's H.15 Selected Interest Rates release, FRED series DGS10 and DGS30 for the daily US Treasury chart, Fed Chair Kevin Warsh's keynote remarks at the 2026 Jackson Hole Economic Policy Symposium, CNBC's reporting on Treasury yields in the days before the speech for the bond-buyback and oil-price context behind the dip, the Bureau of Labor Statistics August 2026 Employment Situation release, Investing.com's India 10 Year Bond Yield historical data for the daily India yield chart, and Trading Economics on India's 10 year yield for wider context.
All figures are from NSE end of day bhavcopy data, as published on bhavcopydata.com. Follow the author at @psanivarapu or at prashanthsanivarapu for more.